

doi: 10.1016/j.ntt.2006.03.003.
Neuroimaging of prenatal drug exposure
Affiliations
- PMID: 16832875
- PMCID: PMC7770627
- DOI: 10.1016/j.ntt.2006.03.003
Item in Clipboard
Neuroimaging of prenatal drug exposure
Neurotoxicol Teratol.
2006 May-Jun.
No abstract available
Figures
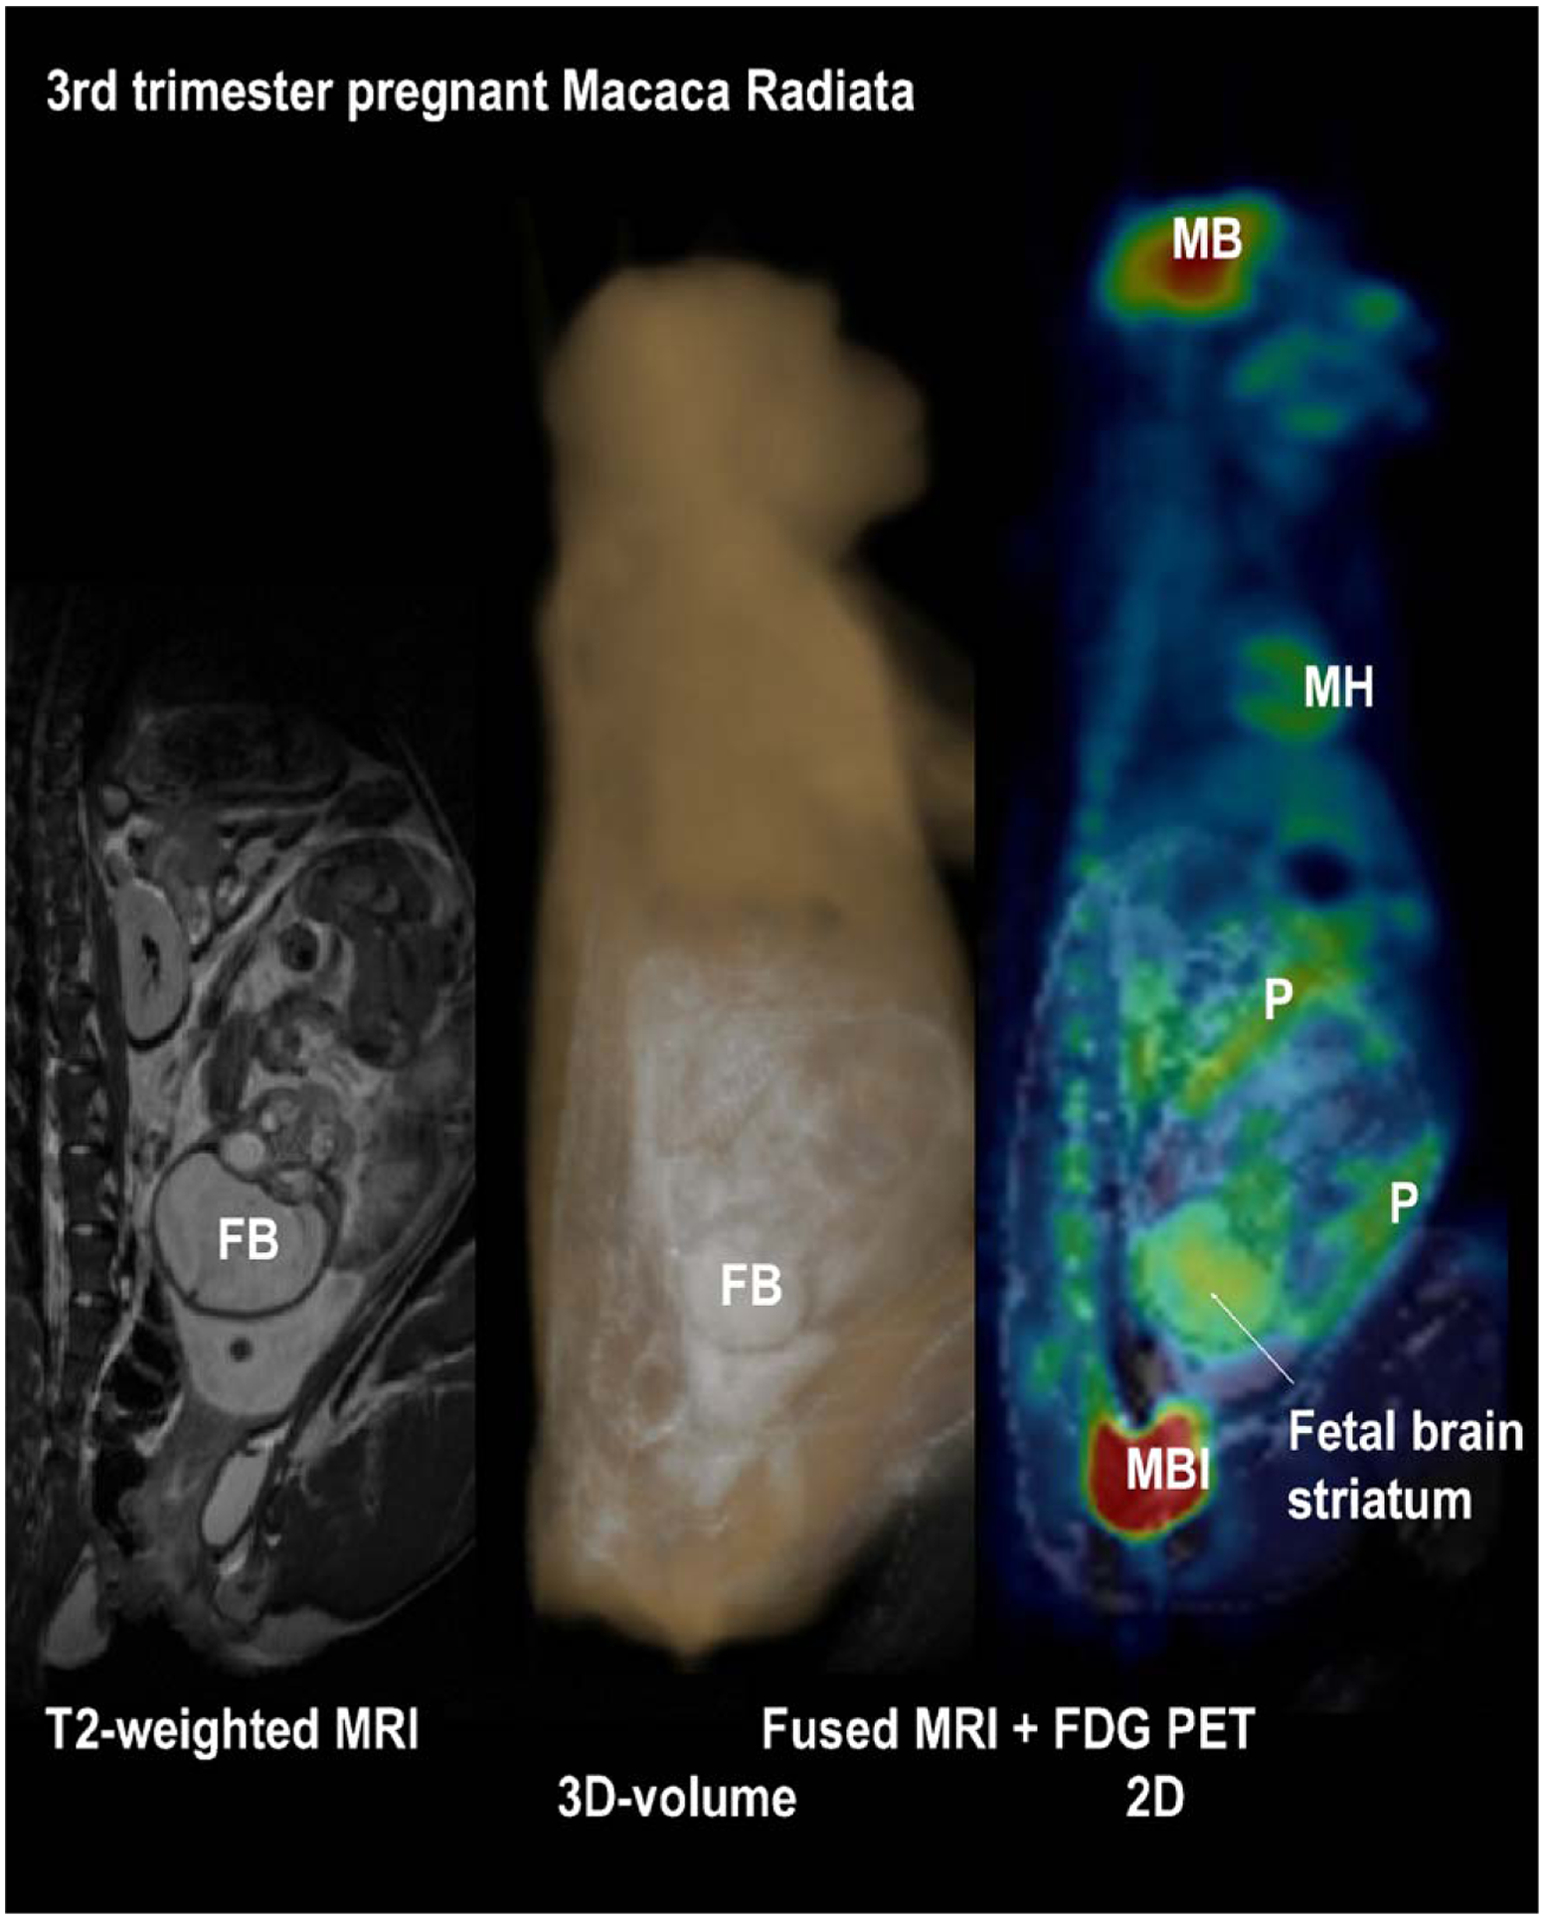
MRI and PET images from the same 3rd trimester pregnant Macaque radiata. The figure shows the T2-weighted MRI acquired at a spatial resolution of 0.78×0.625×2 mm3 (left), the volume rendered fused MRI and corresponding FDG PET image (middle) and a 2D fused MRI and PET data set of this subject (right). FB = fetal brain; MB = maternal brain: MBI = maternal bladder: P = placenta.

Typical MRSI slab orientation used for our study (parallel to AC–PC plane) and approximate location of the slices (1–8) are shown on a sagittal MRI image (A). Images F–I and N–Q show the distribution of the metabolite, N-acetyl aspartate, across the 8 slices of 15 mm thickness, and their corresponding MRIs are shown in images B–E and J–M, respectively. Poor spectral quality, due to magnetic field susceptibility variation induced magnetic field changes, results in unreliable metabolite map in the frontal lobe as indicated by an arrow in I.

3 T 3-D whole brain magnetic resonance spectroscopic imaging (MRSI) performed in a healthy 19-year-old male. This figure shows typical quality of spectra obtained from multiple voxel locations, shown on the T1-weighted MRI, of a 15 mm thickness slice in a 3D whole brain MRSI data set. Spectra sampled from the frontal (A) to posterior (B) regions show peaks for the prominent cerebral metabolites, choline (Cho), creatine (Cr) and N-acetyl aspartate (NAA). Data were acquired using a 3D-EPSI sequence with a TE of 70 ms, TR of 1800 ms and an acquisition time of 26 min.

3 T left frontal lobe single-voxel magnetic resonance spectroscopy (MRS) performed in a healthy 19-year-old male. This figure depicts creatine (Cr), choline (Cho), and N-acetyl aspartate (NAA) peaks. Data were acquired using a single voxel point resolved spectroscopy (PRESS) sequence with a TE of 30 ms, TR of 2000 ms and an acquisition time of approximately 9 min.

Grey matter increase adjacent to the corpus callosum as a function of severity of cocaine usage.

Autoradiographic images showing the distribution of CB1 mRNA expression in coronal sections in human adult (A, B, C) and mid-gestation fetal (A′, B′, C′) brains at the level of the nucleus accumbens (A, A′), amygdaloid complex (B, B′) and hippocampus (C, C′). Note the higher overall expression of the CB1 mRNA to various structures in the adult versus fetal brain and the predominant expression of CB1 mRNA to the fetal amygdaloid complex and hippocampus. B, basal amygdala nucleus; CA2/CA3, cornu ammoni 2/3; CL, claustrum; CN, caudate nucleus; Dg, dentate gyrus; GL, germinal layer; Gpe, globus pallidus external; Gpi, globus pallidus internal; L, lateral amygdala nucleus; Pu, putamen; S, subiculum. Scale bar=1 cm. Modified from Wang et al. [94].

CB1 agonist (WIN 55, 212–2)-activated GTPγS binding in the human mid-gestational fetal brain. Non-specific binding (A); basal binding without agonist (B); agonist (10 μM WIN) activation (C); agonist and CB1 antagonist (10 μM WIN+3 μM SR141716A; D). Note the activation of CB1 agonist binding in, e.g., the globus pallidus (output structure of the striatum) which is blocked by CB1 antagonist reflecting the functional coupling of the CB1 receptors at this stage of fetal development. Abbreviation list in Fig. 6 legend.
Similar articles
-
Introduction to "Understanding developmental consequences of prenatal drug exposure: Biological and environmental effects and their interactions".Neurotoxicol Teratol. 2011 Jan-Feb;33(1):5-8. doi: 10.1016/j.ntt.2010.10.007. Epub 2010 Nov 1. Neurotoxicol Teratol. 2011. PMID: 21047553 No abstract available.
-
Neuroimaging effects of prenatal alcohol exposure on the developing human brain: a magnetic resonance imaging review.Acta Neuropsychiatr. 2015 Oct;27(5):251-69. doi: 10.1017/neu.2015.12. Epub 2015 Mar 17. Acta Neuropsychiatr. 2015. PMID: 25780875 Review.
-
Associations of Maternal Prenatal Drug Abuse With Measures of Newborn Brain Structure, Tissue Organization, and Metabolite Concentrations.JAMA Pediatr. 2020 Sep 1;174(9):831-842. doi: 10.1001/jamapediatrics.2020.1622. JAMA Pediatr. 2020. PMID: 32539126 Free PMC article.
-
Umbilical Cord Tissue and Meconium May Not Be Equivalent for Confirming in Utero Substance Exposure.J Pediatr. 2019 Feb;205:277-280. doi: 10.1016/j.jpeds.2018.09.046. Epub 2018 Oct 17. J Pediatr. 2019. PMID: 30342870 Free PMC article.
-
Neuroimaging is a novel tool to understand the impact of environmental chemicals on neurodevelopment.Curr Opin Pediatr. 2014 Apr;26(2):230-6. doi: 10.1097/MOP.0000000000000074. Curr Opin Pediatr. 2014. PMID: 24535497 Free PMC article. Review.
Cited by
-
Molecular mechanisms of maternal cannabis and cigarette use on human neurodevelopment.Eur J Neurosci. 2011 Nov;34(10):1574-83. doi: 10.1111/j.1460-9568.2011.07884.x. Eur J Neurosci. 2011. PMID: 22103415 Free PMC article. Review.
-
Fifty Years of Research on Prenatal Substances: Lessons Learned for the Opioid Epidemic.Advers Resil Sci. 2020 Dec;1(4):223-234. doi: 10.1007/s42844-020-00021-7. Epub 2020 Oct 27. Advers Resil Sci. 2020. PMID: 34316723 Free PMC article.
-
Comparison of 12-year-old children with prenatal exposure to cocaine and non-exposed controls on caregiver ratings of executive function.J Youth Adolesc. 2014 Jan;43(1):53-69. doi: 10.1007/s10964-013-9927-3. Epub 2013 Feb 20. J Youth Adolesc. 2014. PMID: 23423839 Free PMC article.
-
Prenatal and concurrent cocaine, alcohol, marijuana, and tobacco effects on adolescent cognition and attention.Drug Alcohol Depend. 2018 Oct 1;191:37-44. doi: 10.1016/j.drugalcdep.2018.06.022. Epub 2018 Jul 25. Drug Alcohol Depend. 2018. PMID: 30077054 Free PMC article.
-
Prenatal drug exposure affects neonatal brain functional connectivity.J Neurosci. 2015 Apr 8;35(14):5860-9. doi: 10.1523/JNEUROSCI.4333-14.2015. J Neurosci. 2015. PMID: 25855194 Free PMC article.
References
-
- Adolphs R, Neural systems for recognizing emotion, Curr. Opin. Neurobiol 12 (2002) 169–177. - PubMed
-
- Bandstra ES, Morrow CE, Anthony JC, Churchill SS, Chitwood DD, Steele BM, Ofir AY, Xue L, Intrauterine growth of full-term infants: impact of prenatal cocaine exposure, Pediatrics 108 (2001) 1309–1319. - PubMed
-
- Bandstra ES, Morrow CE, Anthony JC, Accornero VH, Fried PA, Longitudinal investigation of task persistence and sustained attention in children with prenatal cocaine exposure, Neurotoxicol. Teratol 23 (2001) 545–559. - PubMed
-
- Bandstra ES, Morrow CE, Accornero VH, Johnson AL, Vogel AL, Xue L, Anthony JC, The Miami Prenatal Cocaine Study: neuropsychological function at age 7 years, “Cocaine Kids Go To School” at the Society for Research in Child Development Biennial Meeting, Tampa, FL, April, 2003.
-
- Behnke M, Eyler FD, Conlon M, Wobie K, Woods NS, Cumming W, Incidence and description of structural brain abnormalities in cocaine-exposed newborns, J. Pediatr 132 (1998) 291–294. - PubMed
Publication types
MeSH terms
Substances
Grants and funding
LinkOut - more resources
Full Text Sources
Medical