

Hydrogeochemistry of seasonal variation of Urmia Salt Lake, Iran
- PMID: 16834770
- PMCID: PMC1533838
- DOI: 10.1186/1746-1448-2-9
Hydrogeochemistry of seasonal variation of Urmia Salt Lake, Iran
Abstract
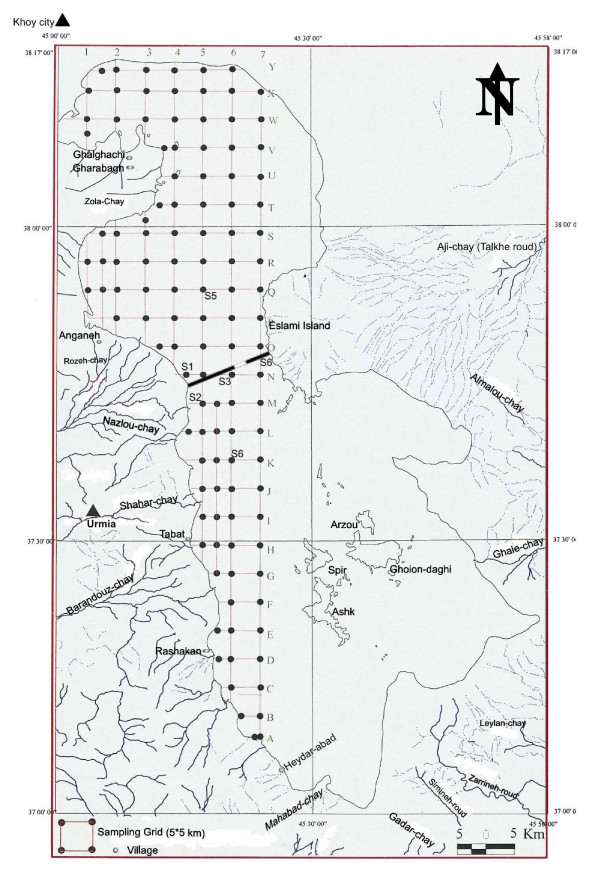
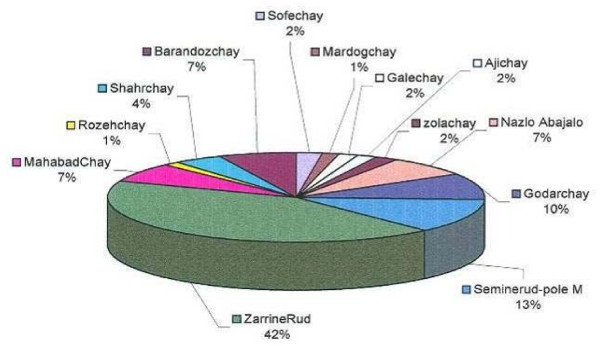
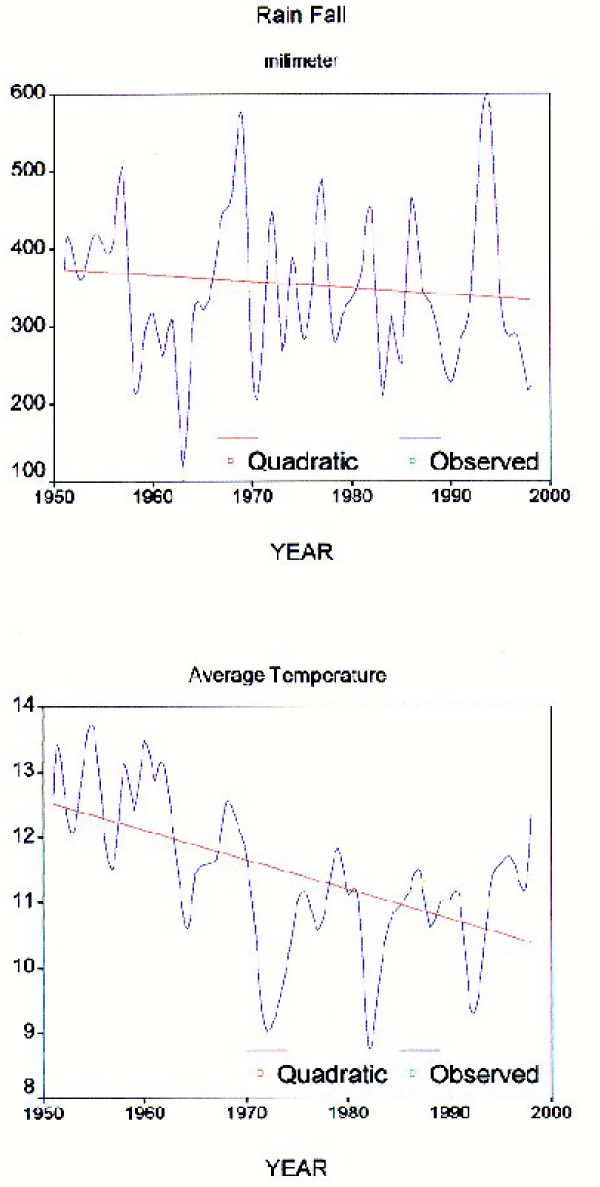
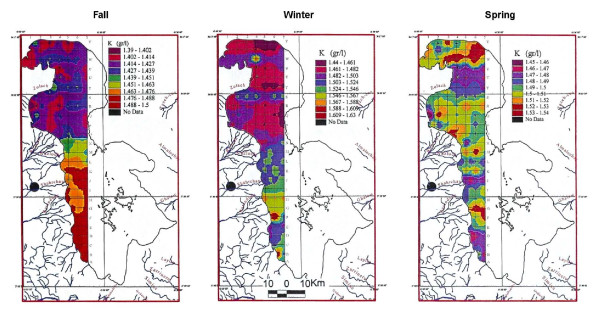
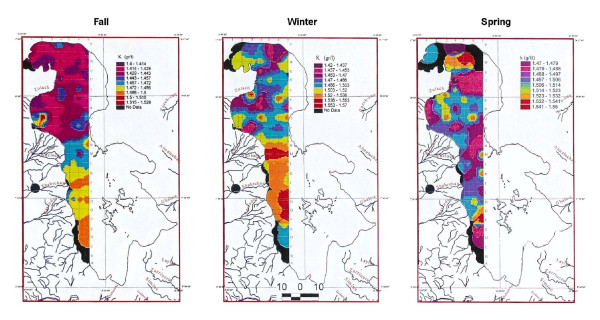
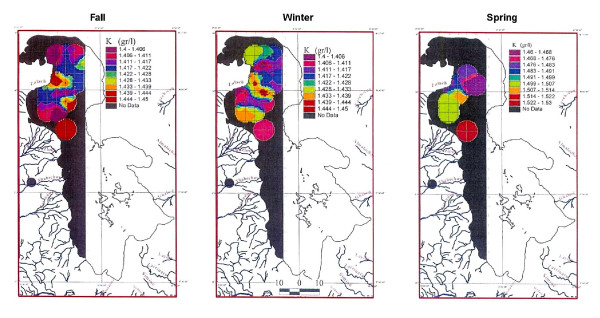
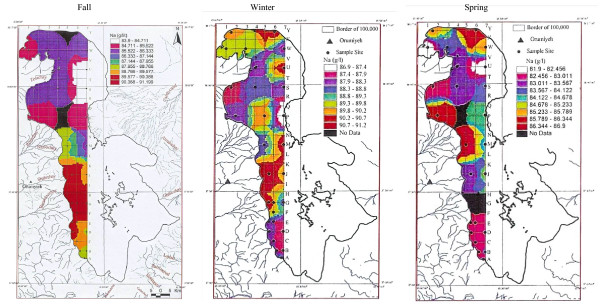
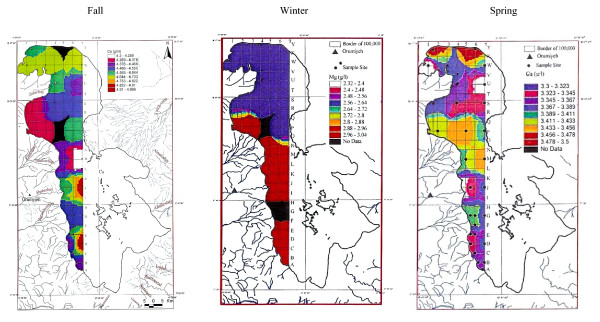
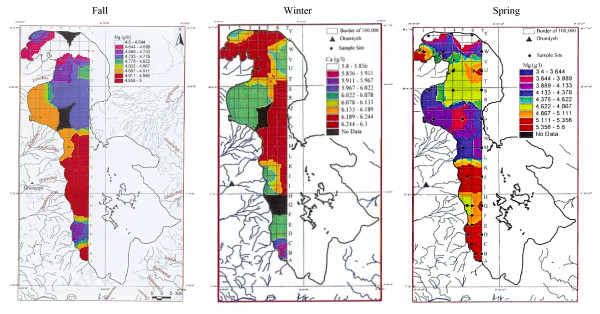
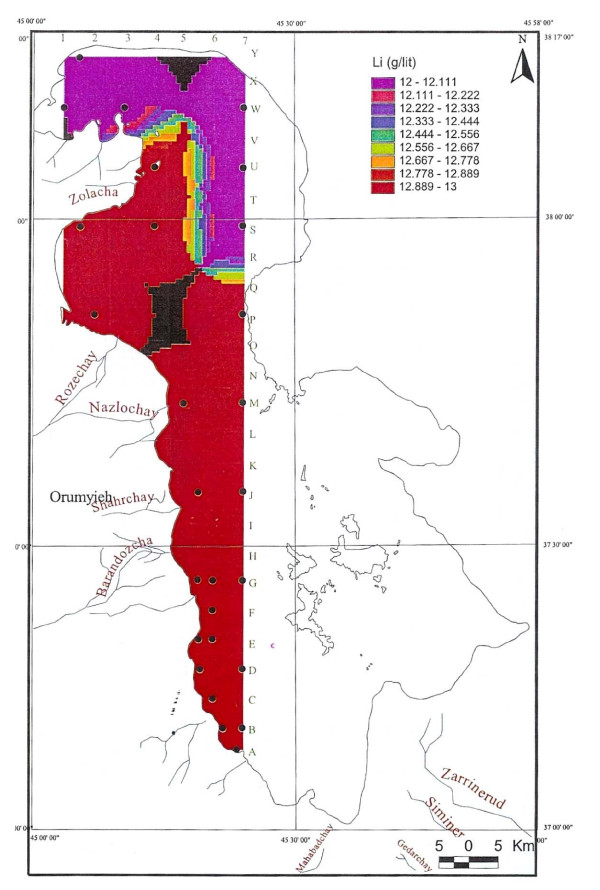
Urmia Lake has been designated as an international park by the United Nations. The lake occupies a 5700 km2 depression in northwestern Iran. Thirteen permanent rivers flow into the lake. Water level in the lake has been decreased 3.5 m in the last decade due to a shortage of precipitation and progressively dry climate. Geologically the lake basin is considered to be a graben of tectonic origin. Na, K, Ca, Li and Mg are the main cations with Cl, SO4, and HCO3 as the main anions. F & Br are the other main elements in the lake. A causeway crossing the lake is under construction, which may affect the lake's annual geochemistry. The main object of this project is mainly to consider the potential of K-mineral production along with ongoing salt production. Seven hundred and four samples were taken and partially analyzed for the main cations and anions. Surface water (0.5 m. depth) was analyzed for Na, K, Mg, Ca, Br and Li, and averaged 87.118 g/lit, 1.48 g/lit, 4.82 g/lit, 4.54 g/lit, 1.19 ppm and 12.7 ppm respectively for the western half of the lake. Sodium ranged between 84 to 91.2 g/lit, and showed higher concentrations in the south than in the north. This unexpected result may be caused by shallower depth in the south and a higher net evaporation effect. Calcium ranged between 4.2 to 5 g/lit, apparently slightly higher in the north. K is higher in the south, possibly due to rivers entering from south that may carry slightly higher K in solution. In the middle-range samples (0.5-5 m.), K averaged 1.43 g/lit and ranged from 1.40 to 1.46 g/lit. At this intermediate depth the distribution of K is clearly higher to the south of the causeway that is currently under construction. It is not clear whether this increase is the effect of the causeway or the effect of the salty Aji-Chay River to the east, and the Khoy salt domes to the north of the lake. At depth (5 m-10 m), K averaged 1.48 g/lit and ranged from 1.4 to 1.49 g/lit, differing only in the second decimal from the average of the middle and surface samples. Ignoring the small difference between the averages of the three sample depths, the distribution of K is highly homogeneous in the lake water due to the mixing process. Therefore causeway construction has not yet strongly affected K distribution, or it may be at the starting point. Magnesium concentration ranged from 4.6 to 5-g/lit, and was elevated in the south. This differs somewhat compared to calcium. Lithium, with an average of 12-13 ppm, is slightly higher in the south, and has not shown any significant variation in all three seasons. Iodine was below the detection limit in the lake. Urmia Lake, geochemically, is highly uniform both to the south and north of the causeway, in both the surface and deep brines. K and Mg, which average 1.48 and 6.6 g/lit in order, could be elements worth production in addition to the NaCl currently being produced from the lake. Br, F, Li and B in the limit of <50 ppm don't look to be in the economical range.
Figures
Similar articles
-
Urmia Lake (Northwest Iran): a brief review.Saline Syst. 2007 May 16;3:5. doi: 10.1186/1746-1448-3-5. Saline Syst. 2007. PMID: 17506897 Free PMC article.
-
40-years of Lake Urmia restoration research: Review, synthesis and next steps.Sci Total Environ. 2022 Aug 1;832:155055. doi: 10.1016/j.scitotenv.2022.155055. Epub 2022 Apr 6. Sci Total Environ. 2022. PMID: 35395306 Review.
-
How Do Changes to the Railroad Causeway in Utah's Great Salt Lake Affect Water and Salt Flow?PLoS One. 2015 Dec 7;10(12):e0144111. doi: 10.1371/journal.pone.0144111. eCollection 2015. PLoS One. 2015. PMID: 26641101 Free PMC article.
-
Total Mercury and Methylmercury Response in Water, Sediment, and Biota to Destratification of the Great Salt Lake, Utah, United States.Environ Sci Technol. 2017 May 2;51(9):4887-4896. doi: 10.1021/acs.est.6b05790. Epub 2017 Apr 21. Environ Sci Technol. 2017. PMID: 28399629
-
Great Salt Lake microbiology: a historical perspective.Int Microbiol. 2018 Sep;21(3):79-95. doi: 10.1007/s10123-018-0008-z. Epub 2018 Jun 4. Int Microbiol. 2018. PMID: 30810951 Free PMC article. Review.
Cited by
-
Monitoring and Assessment of Water Level Fluctuations of the Lake Urmia and Its Environmental Consequences Using Multitemporal Landsat 7 ETM+ Images.Int J Environ Res Public Health. 2020 Jun 12;17(12):4210. doi: 10.3390/ijerph17124210. Int J Environ Res Public Health. 2020. PMID: 32545634 Free PMC article.
-
Characterization of basidiomycetous yeasts in hypersaline soils of the Urmia Lake National Park, Iran.Extremophiles. 2016 Nov;20(6):915-928. doi: 10.1007/s00792-016-0883-1. Epub 2016 Oct 21. Extremophiles. 2016. PMID: 27770301
-
Saline Systems highlights for 2006.Saline Syst. 2007 Jan 23;3:1. doi: 10.1186/1746-1448-3-1. Saline Syst. 2007. PMID: 17244355 Free PMC article.
-
Survival of the Halophilic Archaeon Halovarius luteus after Desiccation, Simulated Martian UV Radiation and Vacuum in Comparison to Bacillus atrophaeus.Orig Life Evol Biosph. 2020 Dec;50(3-4):157-173. doi: 10.1007/s11084-020-09597-7. Epub 2020 Jul 2. Orig Life Evol Biosph. 2020. PMID: 32617792
-
Fresh water resource, scarcity, water salinity challenges and possible remedies: A review.Heliyon. 2023 Jul 26;9(8):e18685. doi: 10.1016/j.heliyon.2023.e18685. eCollection 2023 Aug. Heliyon. 2023. PMID: 37554830 Free PMC article. Review.
References
-
- Daneshgar M. PhD Thesis. University of Tabriz, Faculty of Pharmacology; 1996. The study of Urmia Lake water in Sharafkhaneh Area.
-
- Aslani S. Potash extraction from Gagnon Playa. Geological Survey of Iran. 1995.
-
- Joined D, editor. Shlimard: 1891. Mineral Spring waters of Iran. Tabriz University publication; 1970. p. 340.
-
- Joined D, editor. Shirokokorof : 1915. Mineral Spring waters of Iran. Tabriz University publication; 1970. p. 340.
-
- Joined D, editor. Wag Khlopin: 1915. Mineral Spring waters of Iran. Tabriz University publication; 1970. p. 340.
LinkOut - more resources
Full Text Sources
