

Lac repressor hinge flexibility and DNA looping: single molecule kinetics by tethered particle motion
- PMID: 16835309
- PMCID: PMC1524907
- DOI: 10.1093/nar/gkl393
Lac repressor hinge flexibility and DNA looping: single molecule kinetics by tethered particle motion
Abstract
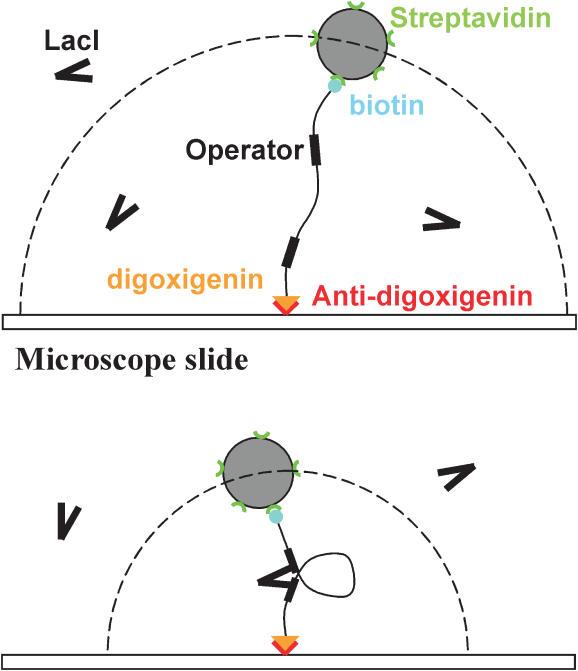
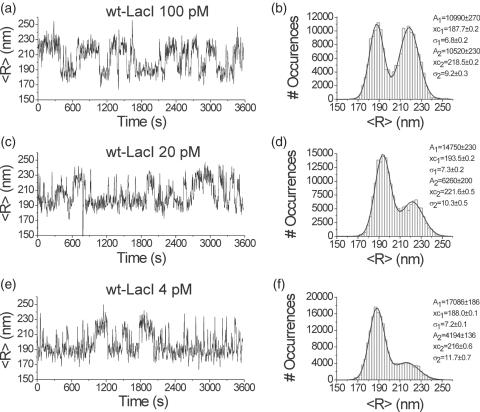
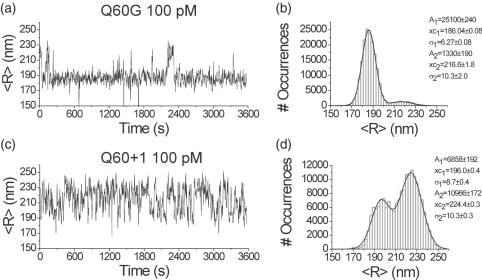
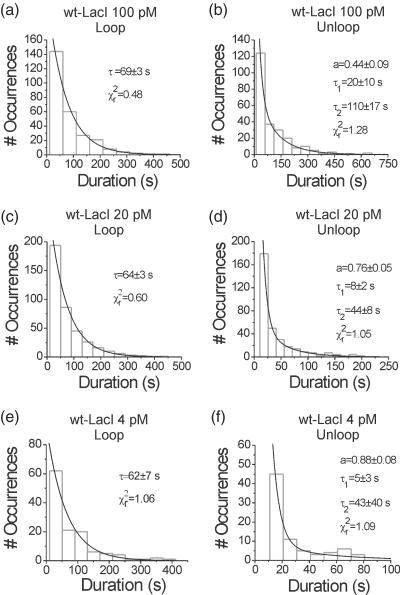
The tethered particle motion (TPM) allows the direct detection of activity of a variety of biomolecules at the single molecule level. First pioneered for RNA polymerase, it has recently been applied also to other enzymes. In this work we employ TPM for a systematic investigation of the kinetics of DNA looping by wild-type Lac repressor (wt-LacI) and by hinge mutants Q60G and Q60 + 1. We implement a novel method for TPM data analysis to reliably measure the kinetics of loop formation and disruption and to quantify the effects of the protein hinge flexibility and of DNA loop strain on such kinetics. We demonstrate that the flexibility of the protein hinge has a profound effect on the lifetime of the looped state. Our measurements also show that the DNA bending energy plays a minor role on loop disruption kinetics, while a strong effect is seen on the kinetics of loop formation. These observations substantiate the growing number of theoretical studies aimed at characterizing the effects of DNA flexibility, tension and torsion on the kinetics of protein binding and dissociation, strengthening the idea that these mechanical factors in vivo may play an important role in the modulation of gene expression regulation.
Figures
Similar articles
-
Hinge-helix formation and DNA bending in various lac repressor-operator complexes.EMBO J. 1999 Nov 15;18(22):6472-80. doi: 10.1093/emboj/18.22.6472. EMBO J. 1999. PMID: 10562559 Free PMC article.
-
Wrapping of flanking non-operator DNA in lac repressor-operator complexes: implications for DNA looping.J Mol Biol. 1999 Dec 3;294(3):639-55. doi: 10.1006/jmbi.1999.3283. J Mol Biol. 1999. PMID: 10610786
-
Bead size effects on protein-mediated DNA looping in tethered-particle motion experiments.Biopolymers. 2011 Feb;95(2):144-50. doi: 10.1002/bip.21547. Epub 2010 Sep 29. Biopolymers. 2011. PMID: 20882535
-
The lac repressor.C R Biol. 2005 Jun;328(6):521-48. doi: 10.1016/j.crvi.2005.04.004. C R Biol. 2005. PMID: 15950160 Review.
-
A gamut of loops: meandering DNA.Trends Biochem Sci. 2005 Jun;30(6):334-41. doi: 10.1016/j.tibs.2005.04.009. Trends Biochem Sci. 2005. PMID: 15950878 Review.
Cited by
-
Tetramer opening in LacI-mediated DNA looping.Proc Natl Acad Sci U S A. 2009 Sep 29;106(39):16627-32. doi: 10.1073/pnas.0904617106. Epub 2009 Sep 21. Proc Natl Acad Sci U S A. 2009. PMID: 19805348 Free PMC article.
-
Protein-mediated loops in supercoiled DNA create large topological domains.Nucleic Acids Res. 2018 May 18;46(9):4417-4424. doi: 10.1093/nar/gky153. Nucleic Acids Res. 2018. PMID: 29538766 Free PMC article.
-
Determination of the number of proteins bound non-specifically to DNA.J Phys Condens Matter. 2010 Oct 20;22(41):414104. doi: 10.1088/0953-8984/22/41/414104. Epub 2010 Sep 30. J Phys Condens Matter. 2010. PMID: 21386587 Free PMC article.
-
Probing DNA topology using tethered particle motion.Methods Mol Biol. 2011;783:295-313. doi: 10.1007/978-1-61779-282-3_16. Methods Mol Biol. 2011. PMID: 21909895 Free PMC article.
-
Sequence dependence of transcription factor-mediated DNA looping.Nucleic Acids Res. 2012 Sep;40(16):7728-38. doi: 10.1093/nar/gks473. Epub 2012 Jun 19. Nucleic Acids Res. 2012. PMID: 22718983 Free PMC article.
References
-
- Jacob F., Monod J. Genetic regulatory mechanisms in the synthesis of proteins. J. Mol. Biol. 1961;3:318–356. - PubMed
-
- Lewis M. The lac repressor. C. R. Biol. 2005;328:521–548. - PubMed
-
- Pfahl M., Gulde V., Bourgeois S. ‘Second’ and ‘third operator’ of the lac operon: an investigation of their role in the regulatory mechanism. J. Mol. Biol. 1979;127:339–344. - PubMed
Publication types
MeSH terms
Substances
LinkOut - more resources
Full Text Sources
Miscellaneous
