

A Mitogen-activated protein kinase controls differentiation of bloodstream forms of Trypanosoma brucei
- PMID: 16835456
- PMCID: PMC1489280
- DOI: 10.1128/EC.00094-06
A Mitogen-activated protein kinase controls differentiation of bloodstream forms of Trypanosoma brucei
Abstract
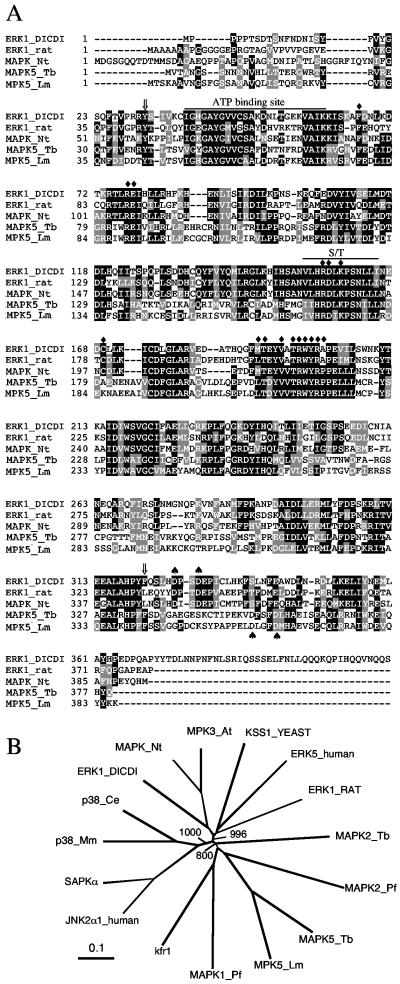
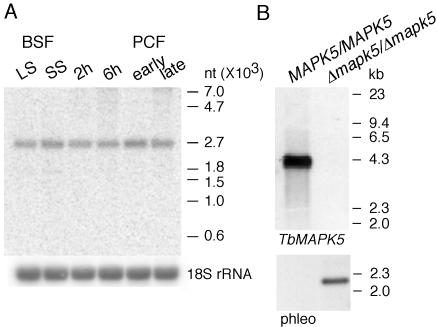
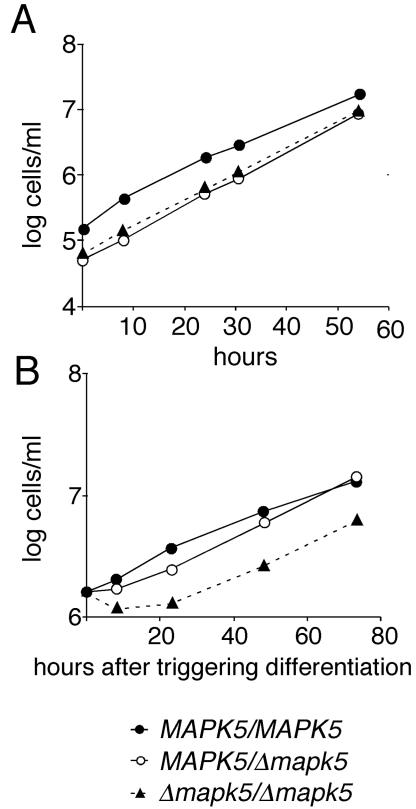
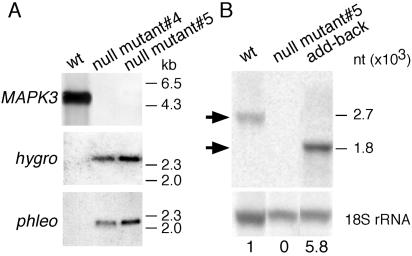
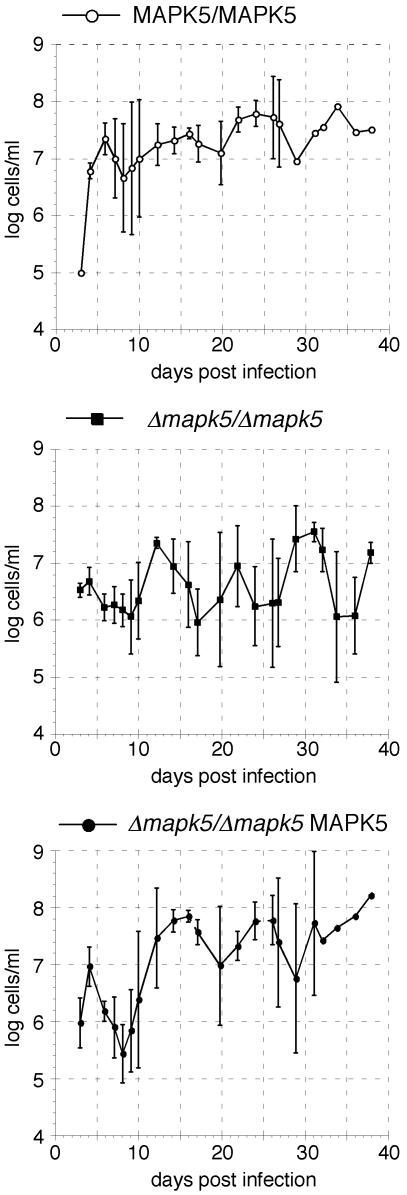
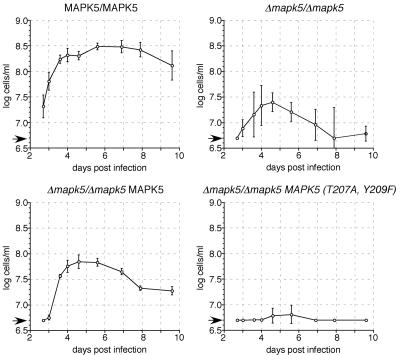
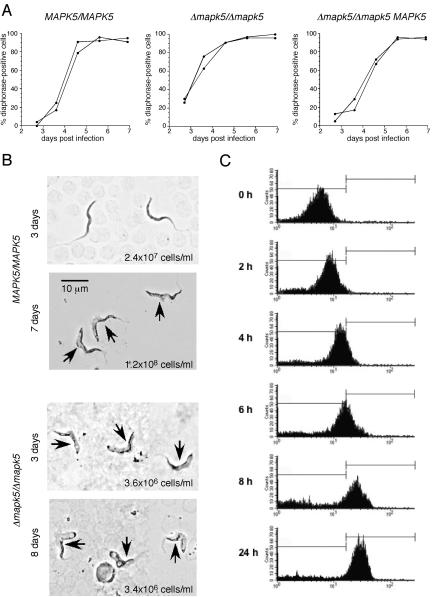
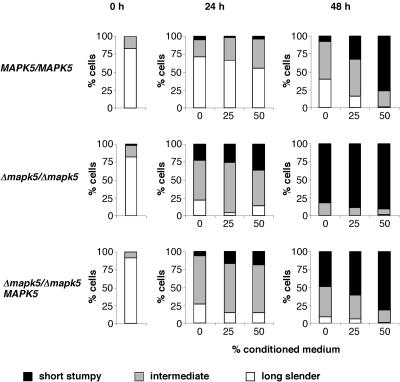
African trypanosomes undergo differentiation in order to adapt to the mammalian host and the tsetse fly vector. To characterize the role of a mitogen-activated protein (MAP) kinase homologue, TbMAPK5, in the differentiation of Trypanosoma brucei, we constructed a knockout in procyclic (insect) forms from a differentiation-competent (pleomorphic) stock. Two independent knockout clones proliferated normally in culture and were not essential for other life cycle stages in the fly. They were also able to infect immunosuppressed mice, but the peak parasitemia was 16-fold lower than that of the wild type. Differentiation of the proliferating long slender to the nonproliferating short stumpy bloodstream form is triggered by an autocrine factor, stumpy induction factor (SIF). The knockout differentiated prematurely in mice and in culture, suggestive of increased sensitivity to SIF. In contrast, a null mutant of a cell line refractory to SIF was able to proliferate normally. The differentiation phenotype was partially rescued by complementation with wild-type TbMAPK5 but exacerbated by introduction of a nonactivatable mutant form. Our results indicate a regulatory function for TbMAPK5 in the differentiation of bloodstream forms of T. brucei that might be exploitable as a target for chemotherapy against human sleeping sickness.
Figures
Similar articles
-
Stage-specific requirement of a mitogen-activated protein kinase by Trypanosoma brucei.Mol Biol Cell. 2002 Nov;13(11):3787-99. doi: 10.1091/mbc.e02-02-0093. Mol Biol Cell. 2002. PMID: 12429824 Free PMC article.
-
Deletion of a novel protein kinase with PX and FYVE-related domains increases the rate of differentiation of Trypanosoma brucei.Mol Microbiol. 2001 Jul;41(1):33-46. doi: 10.1046/j.1365-2958.2001.02471.x. Mol Microbiol. 2001. PMID: 11454198
-
Analysis by flow cytometry of DNA synthesis during the life cycle of African trypanosomes.Acta Trop. 1984 Dec;41(4):313-23. Acta Trop. 1984. PMID: 6152113
-
Antigenic variation during the developmental cycle of Trypanosoma brucei.J Protozool. 1984 Feb;31(1):41-7. J Protozool. 1984. PMID: 6204043 Review.
-
The developmental cell biology of Trypanosoma brucei.J Cell Sci. 2005 Jan 15;118(Pt 2):283-90. doi: 10.1242/jcs.01649. J Cell Sci. 2005. PMID: 15654017 Free PMC article. Review.
Cited by
-
Piplartine-Inspired 3,4,5-Trimethoxycinnamates: Trypanocidal, Mechanism of Action, and In Silico Evaluation.Molecules. 2023 Jun 2;28(11):4512. doi: 10.3390/molecules28114512. Molecules. 2023. PMID: 37298988 Free PMC article.
-
Regulators of Trypanosoma brucei cell cycle progression and differentiation identified using a kinome-wide RNAi screen.PLoS Pathog. 2014 Jan;10(1):e1003886. doi: 10.1371/journal.ppat.1003886. Epub 2014 Jan 16. PLoS Pathog. 2014. PMID: 24453978 Free PMC article.
-
Assembling the components of the quorum sensing pathway in African trypanosomes.Mol Microbiol. 2015 Apr;96(2):220-32. doi: 10.1111/mmi.12949. Epub 2015 Mar 4. Mol Microbiol. 2015. PMID: 25630552 Free PMC article. Review.
-
The phosphoproteome of bloodstream form Trypanosoma brucei, causative agent of African sleeping sickness.Mol Cell Proteomics. 2009 Jul;8(7):1527-38. doi: 10.1074/mcp.M800556-MCP200. Epub 2009 Apr 4. Mol Cell Proteomics. 2009. PMID: 19346560 Free PMC article.
-
The design and synthesis of potent and selective inhibitors of Trypanosoma brucei glycogen synthase kinase 3 for the treatment of human african trypanosomiasis.J Med Chem. 2014 Sep 25;57(18):7536-49. doi: 10.1021/jm500239b. Epub 2014 Sep 8. J Med Chem. 2014. PMID: 25198388 Free PMC article.
References
-
- Amiguet-Vercher, A., D. Perez-Morga, A. Pays, P. Poelvoorde, H. Van Xong, P. Tebabi, L. Vanhamme, and E. Pays. 2004. Loss of the mono-allelic control of the VSG expression sites during the development of Trypanosoma brucei in the bloodstream. Mol. Microbiol. 51:1577-1588. - PubMed
-
- Brun, R., and M. Schönenberger. 1979. Cultivation and in vitro cloning of procyclic culture forms of Trypanosoma brucei in a semi-defined medium. Acta Trop. 36:289-292. - PubMed
-
- Brun, R., and M. Schönenberger. 1981. Stimulating effect of citrate and cis-aconitate on the transformation of Trypanosoma brucei bloodstream forms to procyclic forms in vitro. Z. Parasitenkd. 66:17-24. - PubMed
-
- Cross, G. A. 1996. Antigenic variation in trypanosomes: secrets surface slowly. Bioessays 18:283-291. - PubMed
Publication types
MeSH terms
Substances
LinkOut - more resources
Full Text Sources
