

Gene expression induced by copper stress in the diatom Thalassiosira pseudonana
- PMID: 16835459
- PMCID: PMC1489294
- DOI: 10.1128/EC.00042-06
Gene expression induced by copper stress in the diatom Thalassiosira pseudonana
Abstract
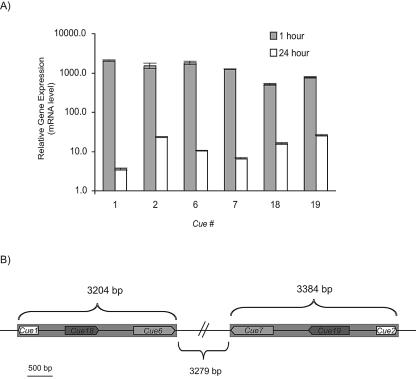
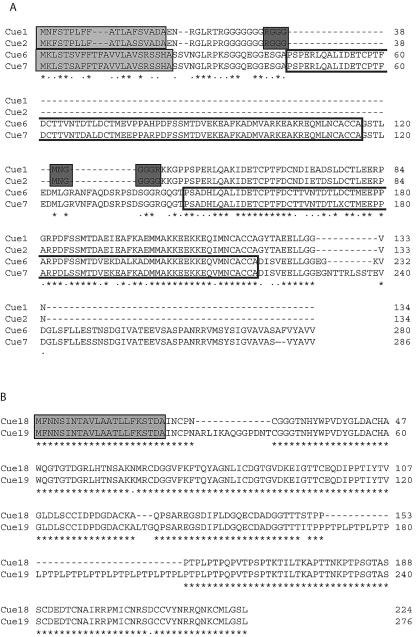
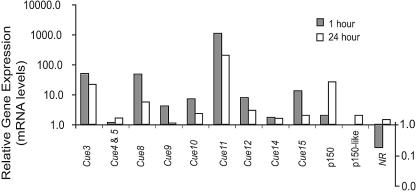
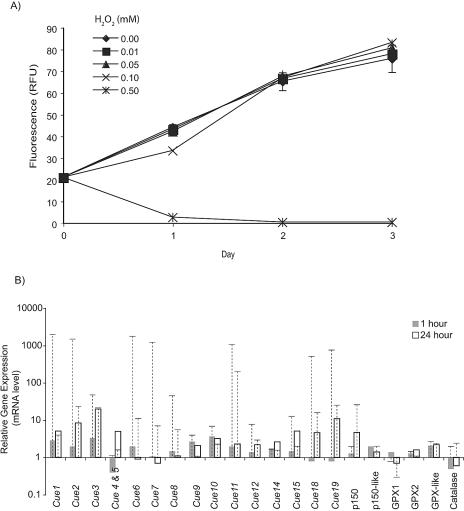
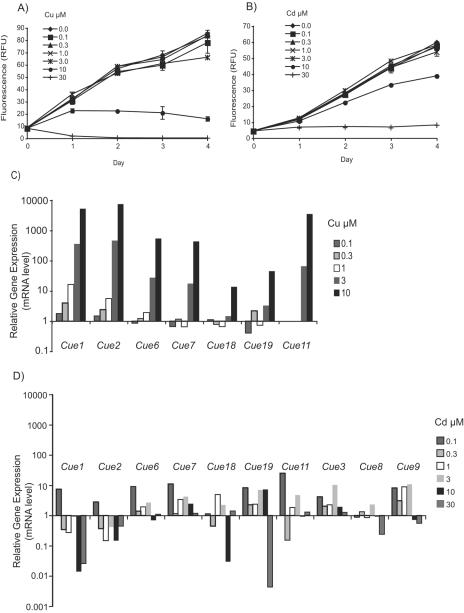
Utilizing a PCR-based subtractive cDNA approach, we demonstrated that the marine diatom Thalassiosira pseudonana exhibits a rapid response at the gene level to elevated concentrations of copper and that this response attenuates over 24 h of continuous exposure. A total of 16 copper-induced genes were identified, 11 of which were completely novel; however, many of the predicted amino acid sequences had characteristics suggestive of roles in ameliorating copper toxicity. Most of the novel genes were not equivalently induced by H2O2- or Cd-induced stress, indicating specificity in response. Two genes that could be assigned functions based on homology were also induced under conditions of general cellular stress. Half of the identified genes were located within two inverted repeats in the genome, and novel genes in one inverted repeat had mRNA levels induced by approximately 500- to 2,000-fold by exposure to copper for 1 h. Additionally, some of the inverted repeat genes demonstrated a dose-dependent response to Cu, but not Cd, and appear to belong to a multigene family. This multigene family may be the diatom functional homolog of metallothioneins.
Figures
Similar articles
-
Characterization of a modular, cell-surface protein and identification of a new gene family in the diatom Thalassiosira pseudonana.Protist. 2008 Apr;159(2):195-207. doi: 10.1016/j.protis.2007.09.006. Epub 2007 Dec 26. Protist. 2008. PMID: 18162437
-
Characterization of the small RNA transcriptome of the diatom, Thalassiosira pseudonana.PLoS One. 2011;6(8):e22870. doi: 10.1371/journal.pone.0022870. Epub 2011 Aug 12. PLoS One. 2011. PMID: 21857960 Free PMC article.
-
8-Oxoguanine DNA glycosylase 1 (OGG1) from the copepod Tigriopus japonicus: molecular characterization and its expression in response to UV-B and heavy metals.Comp Biochem Physiol C Toxicol Pharmacol. 2012 Mar;155(2):290-9. doi: 10.1016/j.cbpc.2011.09.010. Epub 2011 Oct 1. Comp Biochem Physiol C Toxicol Pharmacol. 2012. PMID: 21983336
-
Cloning and characterization of the HSP90 beta gene from Tanichthys albonubes Lin (Cyprinidae): effect of copper and cadmium exposure.Fish Physiol Biochem. 2012 Jun;38(3):745-56. doi: 10.1007/s10695-011-9556-2. Epub 2011 Sep 14. Fish Physiol Biochem. 2012. PMID: 21915694
-
Gene biomarkers in diatom Thalassiosira pseudonana exposed to polycyclic aromatic hydrocarbons from contaminated marine surface sediments.Aquat Toxicol. 2011 Jan 17;101(1):244-53. doi: 10.1016/j.aquatox.2010.10.004. Epub 2010 Oct 19. Aquat Toxicol. 2011. PMID: 21087797
Cited by
-
Complex signatures of genomic variation of two non-model marine species in a homogeneous environment.BMC Genomics. 2018 May 9;19(1):347. doi: 10.1186/s12864-018-4721-y. BMC Genomics. 2018. PMID: 29743012 Free PMC article.
-
The ins and outs of metal homeostasis by the root nodule actinobacterium Frankia.BMC Genomics. 2014 Dec 12;15:1092. doi: 10.1186/1471-2164-15-1092. BMC Genomics. 2014. PMID: 25495525 Free PMC article.
-
Elevated CO2 reduces copper accumulation and toxicity in the diatom Thalassiosira pseudonana.Front Microbiol. 2023 Jan 6;13:1113388. doi: 10.3389/fmicb.2022.1113388. eCollection 2022. Front Microbiol. 2023. PMID: 36687610 Free PMC article.
-
Chitin in diatoms and its association with the cell wall.Eukaryot Cell. 2009 Jul;8(7):1038-50. doi: 10.1128/EC.00079-09. Epub 2009 May 8. Eukaryot Cell. 2009. PMID: 19429777 Free PMC article.
-
Release and toxicity comparison between industrial- and sunscreen-derived nano-ZnO particles.Int J Environ Sci Technol (Tehran). 2016 Oct 1;13:2485-2494. Int J Environ Sci Technol (Tehran). 2016. PMID: 32632346 Free PMC article.
References
-
- Ahner, B., and F. M. M. Morel. 1995. Phytochelatin production in marine algae. 2. Induction by various metals. Limnol. Oceanogr. 40:658-665.
-
- Altschul, S. F., W. Gish, W. Miller, E. W. Myers, and D. J. Lipman. 1990. Basic local alignment search tool. J. Mol. Biol. 215:403-410. - PubMed
-
- Andersen, R. A., S. L. Morton, and J. P. Sexton. 1997. Provasoli-Guillard National Center for Culture of Marine Phytoplankton. J. Phycol. 33(Suppl.):1-75.
-
- Argüello, J. M. 2003. Identification of ion-selectivity determinants in heavy-metal transport P1B-type ATPases. J. Membr. Biol. 195:93-108. - PubMed
-
- Armbrust, E. V., J. A. Berges, C. Bowler, B. R. Green, D. Martinez, N. H. Putnam, S. G. Zhou, A. E. Allen, K. E. Apt, M. Bechner, M. A. Brzezinski, B. K. Chaal, A. Chiovitti, A. K. Davis, M. S. Demarest, J. C. Detter, T. Glavina, D. Goodstein, M. Z. Hadi, U. Hellsten, M. Hildebrand, B. D. Jenkins, J. Jurka, V. V. Kapitonov, N. Kroger, W. W. Y. Lau, T. W. Lane, F. W. Larimer, J. C. Lippmeier, S. Lucas, M. Medina, A. Montsant, M. Obornik, M. S. Parker, B. Palenik, G. J. Pazour, P. M. Richardson, T. A. Rynearson, M. A. Saito, D. C. Schwartz, K. Thamatrakoln, K. Valentin, A. Vardi, F. P. Wilkerson, and D. S. Rokhsar. 2004. The genome of the diatom Thalassiosira pseudonana: ecology, evolution, and metabolism. Science 306:79-86. - PubMed
Publication types
MeSH terms
Substances
LinkOut - more resources
Full Text Sources
Other Literature Sources
