

Impact of biomarkers on disease survival and progression in patients treated with octreotide for advanced hepatocellular carcinoma
- PMID: 16835748
- PMCID: PMC12161025
- DOI: 10.1007/s00432-006-0118-4
Impact of biomarkers on disease survival and progression in patients treated with octreotide for advanced hepatocellular carcinoma
Abstract
Background: Current determination of prognosis for advanced hepatocellular carcinoma (HCC) is mainly based on clinical assessment. We aimed to determine the impact of biomarkers as predictive factors for HCC progression and survival during octreotide-based treatments.
Patients and methods: We included patients who had been prospectively randomised to receive either octreotide (30 mg) alone monthly (n = 39) or in combination with rofecoxib (up to 50 mg bid daily, n = 32) for a minimum of 6 months, or until death occurred.
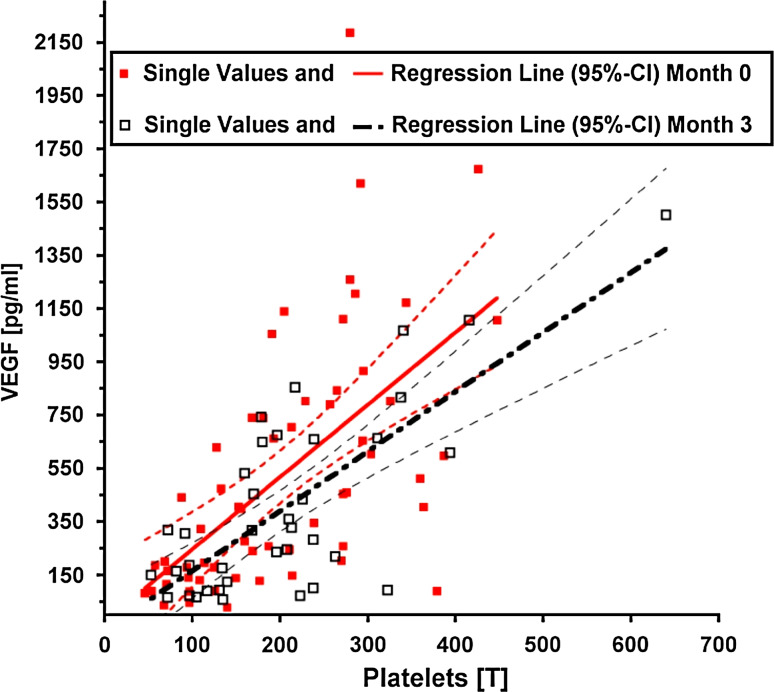
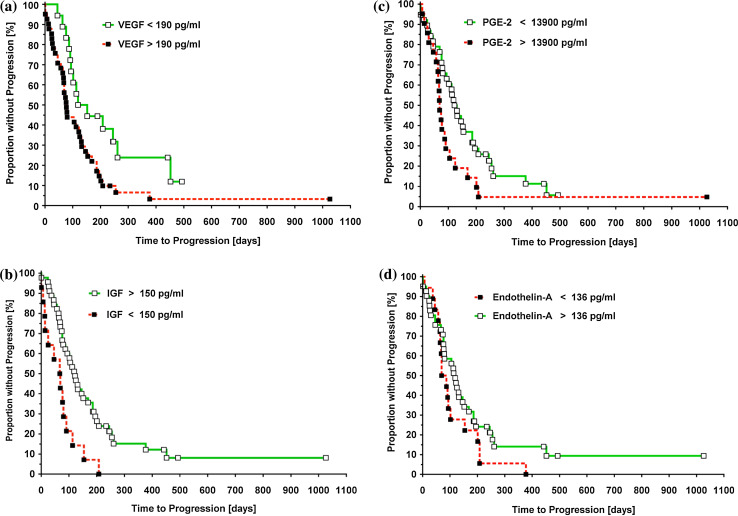
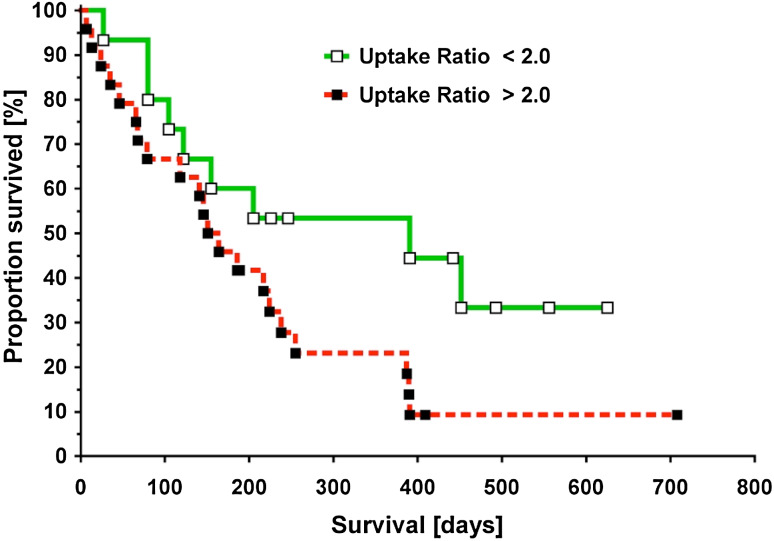
Results: Overall median survival (154 days) and median time to progression (94 days) were not different for both treatments and the biomarkers investigated (VEGF-A, IGF-1, PGE-2, ET-A) were similarly distributed amongst treatment groups. Combined univariate group analysis revealed that survival was decreased for an uptake ratio of > 2 on initial octreoscan (P = 0.05); baseline serum VEGF-A and IGF-1 were further significantly associated with survival. On multivariate analysis, uncorrected serum VEGF-A appeared to be the most significant predictor for tumor progression and survival.
Conclusions: Biomarkers, in addition to established tumor markers, are independent predictors of tumor progression and survival in patients with advanced HCC treated with octreotide. Furthermore, the involvement of VEGF-A implies the inhibition of angiogenesis as a potential mechanism of action for this drug.
Figures


Similar articles
-
Impact of different anticancer regimens on biomarkers of angiogenesis in patients with advanced hepatocellular cancer.J Cancer Res Clin Oncol. 2009 Feb;135(2):271-81. doi: 10.1007/s00432-008-0443-x. Epub 2008 Jul 19. J Cancer Res Clin Oncol. 2009. PMID: 18642029 Free PMC article.
-
Toripalimab plus bevacizumab versus sorafenib as first-line treatment for advanced hepatocellular carcinoma (HEPATORCH): a randomised, open-label, phase 3 trial.Lancet Gastroenterol Hepatol. 2025 Jul;10(7):658-670. doi: 10.1016/S2468-1253(25)00059-7. Epub 2025 May 20. Lancet Gastroenterol Hepatol. 2025. PMID: 40409323 Clinical Trial.
-
Percutaneous ethanol injection or percutaneous acetic acid injection for early hepatocellular carcinoma.Cochrane Database Syst Rev. 2015 Jan 26;1(1):CD006745. doi: 10.1002/14651858.CD006745.pub3. Cochrane Database Syst Rev. 2015. PMID: 25620061 Free PMC article.
-
Impact of residual disease as a prognostic factor for survival in women with advanced epithelial ovarian cancer after primary surgery.Cochrane Database Syst Rev. 2022 Sep 26;9(9):CD015048. doi: 10.1002/14651858.CD015048.pub2. Cochrane Database Syst Rev. 2022. PMID: 36161421 Free PMC article.
-
Ablative and non-surgical therapies for early and very early hepatocellular carcinoma: a systematic review and network meta-analysis.Health Technol Assess. 2023 Dec;27(29):1-172. doi: 10.3310/GK5221. Health Technol Assess. 2023. PMID: 38149643 Free PMC article.
Cited by
-
Somatostatin analogues in the treatment of gastroenteropancreatic neuroendocrine tumours, current aspects and new perspectives.J Exp Clin Cancer Res. 2010 Mar 2;29(1):19. doi: 10.1186/1756-9966-29-19. J Exp Clin Cancer Res. 2010. PMID: 20196864 Free PMC article. Review.
-
Serum VEGF level is associated with the outcome of patients with hepatocellular carcinoma: a meta-analysis.Hepatobiliary Surg Nutr. 2013 Aug;2(4):209-15. doi: 10.3978/j.issn.2304-3881.2013.06.07. Hepatobiliary Surg Nutr. 2013. PMID: 24570945 Free PMC article.
-
Serum insulin-like growth factor-1 and its binding protein 3 as prognostic factors for the incidence, progression, and outcome of hepatocellular carcinoma: a systematic review and meta-analysis.Oncotarget. 2017 Jul 12;8(46):81098-81108. doi: 10.18632/oncotarget.19186. eCollection 2017 Oct 6. Oncotarget. 2017. PMID: 29113370 Free PMC article.
-
Tissue- and Serum-Associated Biomarkers of Hepatocellular Carcinoma.Biomark Cancer. 2016 Jul 4;8(Suppl 1):37-55. doi: 10.4137/BIC.S34413. eCollection 2016. Biomark Cancer. 2016. PMID: 27398029 Free PMC article. Review.
-
Impact of different anticancer regimens on biomarkers of angiogenesis in patients with advanced hepatocellular cancer.J Cancer Res Clin Oncol. 2009 Feb;135(2):271-81. doi: 10.1007/s00432-008-0443-x. Epub 2008 Jul 19. J Cancer Res Clin Oncol. 2009. PMID: 18642029 Free PMC article.
References
-
- Allgaier HP, Becker G, Blum HE (2000) A therapeutic study of hepatocellular carcinoma using octreotide (HECTOR). Hepatocellular carcinoma: treatment with octreotide. Dtsch Med Wochenschr 25:320 - PubMed
-
- Bevan JS (2005) Clinical review: the antitumoral effects of somatostatin analog therapy in acromegaly. J Clin Endocrinol Metab 90:1856–1863 - PubMed
-
- Blaeker M, Schmitz M, Gocht A, et al. (2004) Differential expression of somatostatin receptor subtypes in hepatocellular carcinomas. J Hepatol 41:112–118 - PubMed
-
- Bruix J, Llovet J (2004) Prognostic prediction in HCC: did anybody expect it to be easy? Hepatology 39:551–552
-
- Bruix J, Sherman M, Llovet JM, et al. for the EASL Panel of Experts on HCC (2001) Clinical management of hepatocellular carcinoma. Conclusions of the Barcelona-2000 EASL conference––European Association for the Study of the Liver. J Hepatol 35:421–430 - PubMed
Publication types
MeSH terms
Substances
LinkOut - more resources
Full Text Sources
Other Literature Sources
Medical
Miscellaneous
