. 2006 Nov 15;400(1):143-51.
doi: 10.1042/BJ20060792.

Mapping of glycolytic enzyme-binding sites on human erythrocyte band 3

Affiliations

Mapping of glycolytic enzyme-binding sites on human erythrocyte band 3

Haiyan Chu et al. Biochem J. .

Abstract

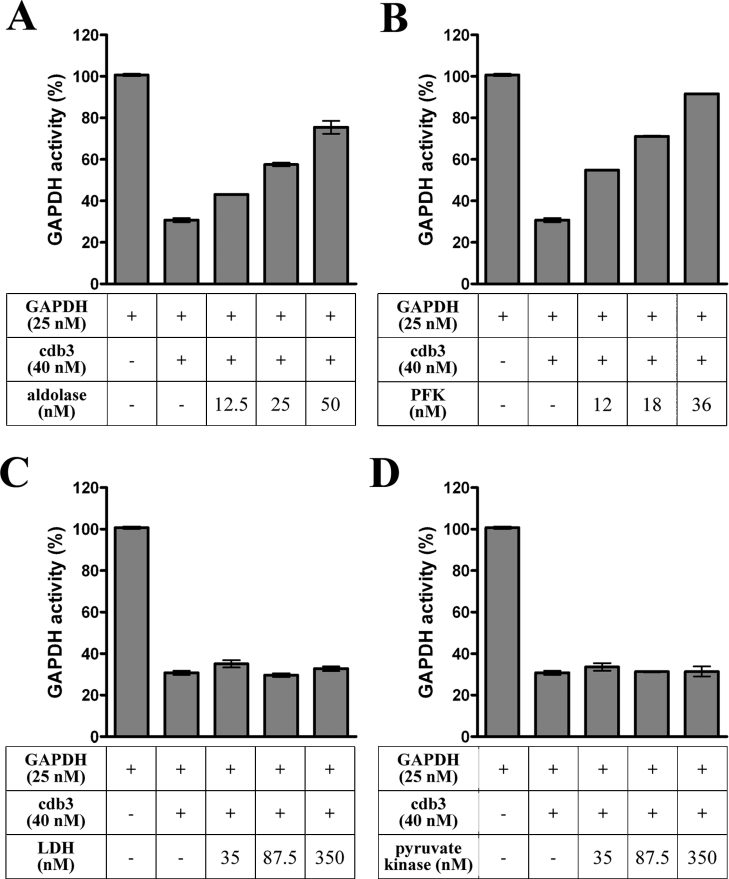
Previous work has shown that GAPDH (glyceraldehyde-3-phosphate dehydrogenase), aldolase, PFK (phosphofructokinase), PK (pyruvate kinase) and LDH (lactate dehydrogenase) assemble into a GE (glycolytic enzyme) complex on the inner surface of the human erythrocyte membrane. In an effort to define the molecular architecture of this complex, we have undertaken to localize the binding sites of these enzymes more accurately. We report that: (i) a major aldolase-binding site on the erythrocyte membrane is located within N-terminal residues 1-23 of band 3 and that both consensus sequences D6DYED10 and E19EYED23 are necessary to form a single enzyme-binding site; (ii) GAPDH has two tandem binding sites on band 3, located in residues 1-11 and residues 12-23 respectively; (iii) a PFK-binding site resides between residues 12 and 23 of band 3; (iv) no GEs bind to the third consensus sequence (residues D902EYDE906) at the C-terminus of band 3; and (v) the LDH- and PK-binding sites on the erythrocyte membrane do not reside on band 3. Taken together, these results argue that band 3 provides a nucleation site for the GE complex on the human erythrocyte membrane and that other components near band 3 must also participate in organizing the enzyme complex.


Figures

Figure 1
Figure 1. Schematic representation of human cdb3 and its mutants used in the present study
Sequences that have been deleted in the different cdb3 mutants are represented as different boxes in the diagram. On the right of the panel is the name of each construct. For deletion mutants, the numbers in parentheses represent the deleted sequence. For substitution mutants, the substituted residues are written in boldface letters and underlined. GST-(872–911) denotes the C-terminal residues 872–911 of band 3 fused to GST at its N terminus.
Figure 2
Figure 2. Effect of cdb3 and its mutants on aldolase activity
Increasing amounts of wild-type cdb3 or its mutants were mixed in a cuvette with 32 pmol of rabbit muscle aldolase (Sigma) in a total volume of 0.1 ml, containing 10 mM sodium phosphate and 0.1 mM EDTA, (pH 6.0). After 5 min incubation, a 0.9 ml solution containing 3.5 mM hydrazine sulfate, 0.1 mM EDTA and 100 μg of fructose-1,6-bisphosphate (pH 6.0) was added. The absorbance at 240 nm was then monitored continuously for 5 min. Aldolase activity was calculated from the absorbance difference between the 100 and 300 s time points. (A) Effect of increasing concentrations of various truncation mutants of cdb3 on the percentage of aldolase inhibition. (B) Effect of increasing concentrations of various substitution mutants of cdb3 on the percentage of aldolase inhibition. (CE) Inhibition of aldolase activity by cdb3 and its mutants at saturating cdb3 concentrations, the effect of wild-type cdb3 is taken as 100%. Maximal inhibition values were determined from the saturation curves in (A) and (B) and plotted for each cdb3 construct.
Figure 3
Figure 3. Effect of cdb3 and its mutants on GAPDH activity
Increasing amounts of wild-type cdb3 and its mutants were mixed in a cuvette with 28 pmol of rabbit muscle GAPDH (Roche) in a total volume of 0.1 ml containing 10 mM imidazole acetate, 0.1 mM EDTA, 0.5 mM sodium arsenate and 1 mM sodium phosphate (pH 7.0). After a 5 min incubation, 0.9 ml of the same imidazole buffer containing 250 μg of NAD+ and 5 μg of glyceraldehyde-3-phosphate was added and the absorbance at 340 nm was monitored continuously for 3 min. GAPDH activity was calculated from the absorbance difference between the 0 and 50 s time points. (A) Effect of increasing concentrations of various truncation mutants of cdb3. (B) Effect of increasing concentrations of various substitution mutants of cdb3. (CE) Inhibition of GAPDH activity by cdb3 and its mutants at saturating cdb3 concentrations, the effect of wild-type cdb3 is taken as 100%. Saturation curves shown in (A) and (B) were determined and the maximal inhibition at saturating cdb3 concentration was plotted for each cdb3 construct.
Figure 4
Figure 4. Effect of cdb3 and its mutants on PFK activity
(A) Increasing amounts of wild-type cdb3 and its mutants were incubated with 16 pmol of PFK in a total volume of 0.2 ml including 10 mM Tris/HCl, 0.2 mM MgCl2, 0.5 mM (NH4)2SO4, 1 mM EDTA, 0.25 mM dithiothreitol and 1.2 mM ATP at pH 7.0; 25 μl of fructose-6-phosphate at 40 mM was then added and the solution was incubated for precisely 3 min. HClO4 (1 ml) was added to deproteinize the solution, and after centrifugation, the supernatant was adjusted to pH 3.5 by addition of potassium carbonate solution. After 15 min on ice, 0.5 ml of supernatant was mixed with 0.5 ml of 10 mM sodium phosphate buffer (pH 7.0) and then NADH plus an enzyme mixture (aldolase, α-glycero-phosphate dehydrogenase and triose-phosphate isomerase) were added. The rate of change in absorbance at 340 nm was monitored with time and used to calculate PFK activity. Both assay A and assay B (as mentioned in the Materials and methods section) give similar results. (B) Inhibition of PFK activity by cdb3 and its mutants at saturating concentrations, the effect of wild-type cdb3 is taken as 100%. Saturation curves shown in (A) were determined and the maximal inhibition at saturating cdb3 concentration was plotted for each cdb3 construct.
Figure 5
Figure 5. Comparison of the inhibition of GAPDH by cdb3 in the absence and presence of increasing concentrations of other GEs
Increasing amounts of aldolase, PFK, LDH, or PK were incubated for 5 min with 40 pmol of cdb3 in a total volume of 0.1 ml, containing 10 mM imidazole acetate, 0.1 mM EDTA, 0.5 mM sodium arsenate and 1 mM sodium phosphate (pH 7.0). GAPDH was added and incubated for an additional 5 min before GAPDH activity was measured in a final volume of 1 ml as described above. GAPDH activity in the absence of cdb3 was taken as 100%. (A) Inhibition of GAPDH by cdb3 in the presence of aldolase. (B) Inhibition of GAPDH by cdb3 in the presence of PFK. (C) Inhibition of GAPDH by cdb3 in the presence of LDH. (D) Inhibition of GAPDH by cdb3 in the presence of PK.
Figure 6
Figure 6. Comparison of direct binding of GEs to wild-type cdb3 and kidney cdb3
Purified wild-type (residues 1–379) or kidney (residues 66–379) cdb3 (0.1 μmol) was immobilized on 1 ml of Affi-Gel 15 beads. To 25 μl of immobilized cdb3 equilibrated in 10 mM imidazole buffer (pH 6.5), excess GE (dialysed against the same buffer) was added and incubated for 10 min at room temperature under gentle agitation. The beads were washed three times with the same buffer and separated into two aliquots. One aliquot was stripped of bound GE in a total volume of 200 μl with 10 mM imidazole and 200 mM NaCl (pH 8.0) and the eluted GE concentration was quantified both by measurement of its catalytic activity and determination of its protein concentration using the BCA assay (A). (Analysis of the samples by BCA assay yielded results similar to the activity data and so the results are not shown.) Alternatively, SDS sample buffer was added to the beads, and after boiling, supernatants were loaded directly on to SDS/polyacrylamide gels for analysis of GEs. wt, GEs released from wild-type cdb3; kidney, GEs released from kidney cdb3; control, pure GEs loaded directly on to gel as molecular-mass marker (B).
Figure 7
Figure 7. Diagram showing residues at the N-terminus of band 3 that participate in GE binding
A possible consensus binding sequence is highlighted in boldface italicized letters. For GAPDH, the boldface box defines the dominant binding site, while the lighter box indicates a weaker interaction site.

Similar articles

Cited by

References

    1. Campanella M. E., Chu H., Low P. S. Assembly and regulation of a glycolytic enzyme complex on the human erythrocyte membrane. Proc. Natl. Acad. Sci. U.S.A. 2005;102:2402–2407. - PMC - PubMed
    1. Hoffman J. F. ATP compartmentation in human erythrocytes. Curr. Opin. Hematol. 1997;4:112–115. - PubMed
    1. Strapazon E., Steck T. L. Interaction of the aldolase and the membrane of human erythrocytes. Biochemistry. 1977;16:2966–2971. - PubMed
    1. Murthy S. N., Liu T., Kaul R. K., Kohler H., Steck T. L. The aldolase-binding site of the human erythrocyte membrane is at the NH2 terminus of band 3. J. Biol. Chem. 1981;256:11203–11208. - PubMed
    1. Tsai I. H., Murthy S. N., Steck T. L. Effect of red cell membrane binding on the catalytic activity of glyceraldehyde-3-phosphate dehydrogenase. J. Biol. Chem. 1982;257:1438–1442. - PubMed

Publication types

MeSH terms