Comparative Study
. 2006 Sep;119(1):98-115.
doi: 10.1111/j.1365-2567.2006.02412.x. Epub 2006 Jul 10.

Immune-privileged embryonic Swiss mouse STO and STO cell-derived progenitor cells: major histocompatibility complex and cell differentiation antigen expression patterns resemble those of human embryonic stem cell lines

Affiliations
Comparative Study

Immune-privileged embryonic Swiss mouse STO and STO cell-derived progenitor cells: major histocompatibility complex and cell differentiation antigen expression patterns resemble those of human embryonic stem cell lines

Katherine S Koch et al. Immunology. 2006 Sep.

Abstract

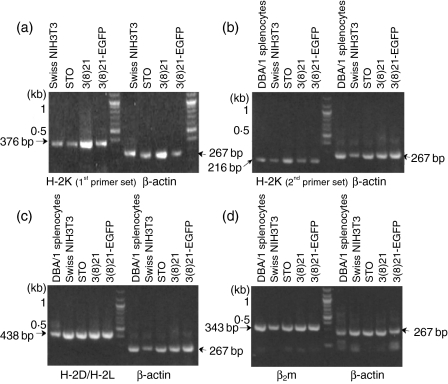
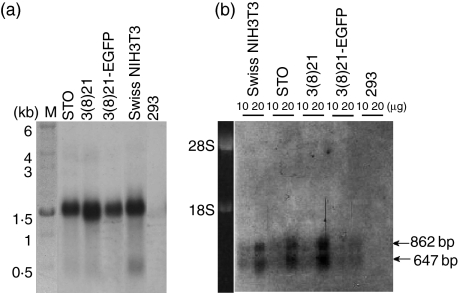
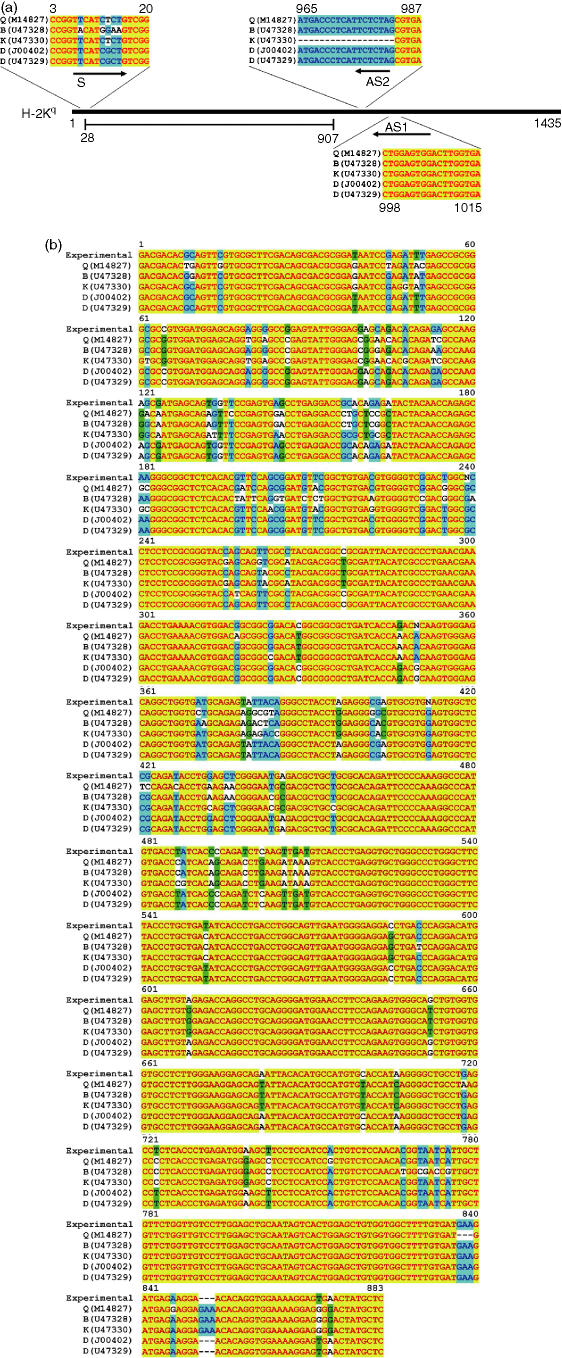
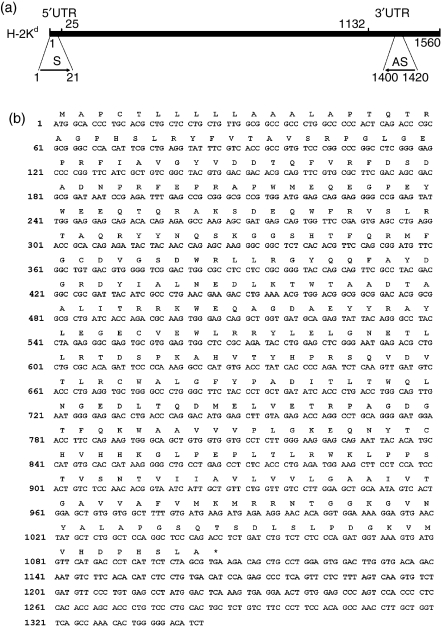
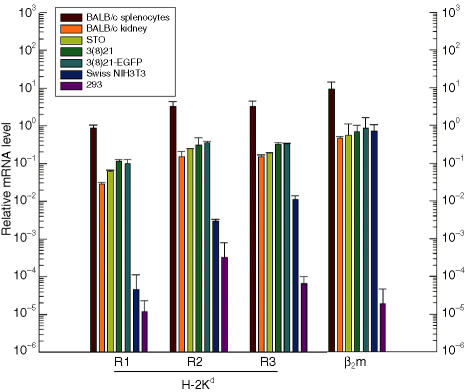
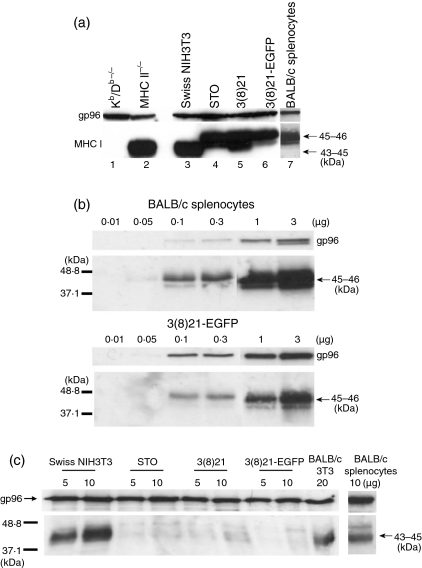
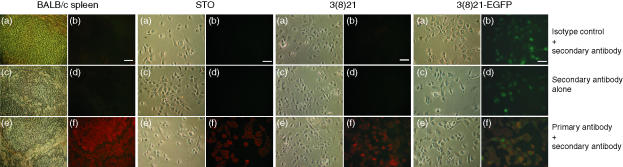
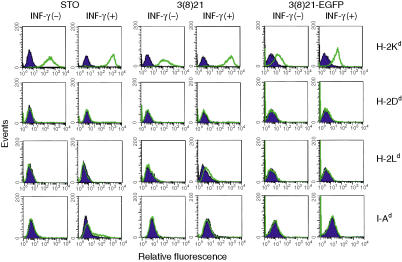
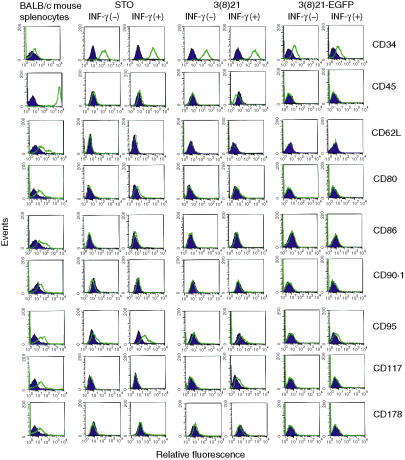
Embryonic mouse STO (S, SIM; T, 6-thioguanine resistant; O, ouabain resistant) and 3(8)21-enhanced green fluorescent protein (EGFP) cell lines exhibit long-term survival and hepatic progenitor cell behaviour after xenogeneic engraftment in non-immunosuppressed inbred rats, and were previously designated major histocompatibility complex (MHC) class I- and class II-negative lines. To determine the molecular basis for undetectable MHC determinants, the expression and haplotype of H-2K, H-2D, H-2L and I-A proteins were reassessed by reverse transcriptase-polymerase chain reaction (RT-PCR), cDNA sequencing, RNA hybridization, immunoblotting, quantitative RT-PCR (QPCR), immunocytochemistry and flow cytometry. To detect cell differentiation (CD) surface antigens characteristic of stem cells, apoptotic regulation or adaptive immunity that might facilitate progenitor cell status or immune privilege, flow cytometry was also used to screen untreated and cytokine [interferon (IFN)-gamma]-treated cultures. Despite prior PCR genotyping analyses suggestive of H-2q haplotypes in STO, 3(8)21-EGFP and parental 3(8)21 cells, all three lines expressed H-2K cDNA sequences identical to those of d-haplotype BALB/c mice, as well as constitutive and cytokine-inducible H-2K(d) determinants. In contrast, apart from H-2L(d[LOW]) display in 3(8)21 cells, H-2Dd, H-2Ld and I-Ad determinants were undetectable. All three lines expressed constitutive and cytokine-inducible CD34; however, except for inducible CD117([LOW]) expression in 3(8)21 cells, no expression of CD45, CD117, CD62L, CD80, CD86, CD90.1 or CD95L/CD178 was observed. Constitutive and cytokine-inducible CD95([LOW]) expression was detected in STO and 3(8)21 cells, but not in 3(8)21-EGFP cells. MHC (class I(+[LOW])/class II-) and CD (CD34+/CD80-/CD86-/CD95L-) expression patterns in STO and STO cell-derived progenitor cells resemble patterns reported for human embryonic stem cell lines. Whether these patterns reflect associations with mechanisms that are regulatory of immune privilege or functional tissue-specific plasticity is unknown.


Figures

Figure 1
Figure 1
Detection of major histocompatibility complex (MHC) class I and β2-microglobulin (β2m) mRNAs in STO (S, SIM; T, 6-thioguanine resistant; O, ouabain resistant) and STO cell-derived (SCD) [3(8)21 and 3(8)21-enhanced green fluorescent protein (EGFP)] cells. RNA extracts were analysed by reverse transcriptase–polymerase chain reaction (RT-PCR) for exonic expression of putative H-2K and H-2D/H-2L mRNAs using primers chosen from the q-haplotype cDNA sequence; the β2m cDNA sequence was used to design invariant β2m primers. Swiss NIH3T3 cells and DBA/1 splenocytes served as sources of authentic H-2Kq mRNA; β-actin determinations served as loading controls. Electrophoresed RT-PCR products are shown on agarose gels transilluminated under ultraviolet light. (a) H-2K mRNA (first primer set); (b) H-2K mRNA (second primer set); (c) H-2D/H-2L mRNA; and (d) β2m mRNA (invariant mouse-specific primer set). See text for further details.
Figure 2
Figure 2
Size analyses of H-2K and β2 microglobulin (β2m) mRNAs in STO (S, SIM; T, 6-thioguanine resistant; O, ouabain resistant) and STO cell-derived (SCD) cells. RNA extracts were analysed by northern blotting using labelled hybridization probes specific for invariant β2m mRNAs and non-specific for H-2K mRNAs. Swiss NIH3T3 cells were used as a positive control for β2m mRNA expression; human 293 cells were used as negative controls for both types of mRNAs. (a) H-2K mRNA. The track at the left gives kb size standards; 2 µg of each poly (A)+ RNA sample was analysed. (b) β2m mRNAs. The track at the left gives rRNA size standards; 10 and 20 µg of each total RNA sample were analysed. The relative positions of hybridization complexes were visualized on autoradiograms of northern blots; hybridization signals in (b) were heightened uniformly by image processing. See text for further details.
Figure 3
Figure 3
Partial cDNA sequence of H-2K heavy chains in STO (S, SIM; T, 6-thioguanine resistant; O, ouabain resistant) and STO cell-derived (SCD) cells. Messenger RNAs from STO, 3(8)21 and 3(8)21-enhanced green fluorescent protein (EGFP) cell extracts were amplified by reverse transcriptase–polymerase chain reaction (RT-PCR) using non-specific sense (S) and antisense (AS1) primers designed against the H-2K q-haplotype sequence [GenBank M14827]. Purified PCR products were subjected to sequencing using primers S, AS1 and AS2 [see (a)]. Sequencing reactions were performed twice, and the resulting sequences were aligned by standard procedures. (a) Sequencing strategy diagram. DNA sequences, homologous but not identical to the primers employed, were obtained from published H-2K molecules of b-, k-, DBA/2 d-, and BALB/c d-haplotypes, and are shown for comparison. S and AS1 were used as RT-PCR primers, and S, AS1 and AS2 as sequencing primers. (b) Experimental consensus sequence and comparative sequence alignments. The ‘experimental’ sequence (top row) reflects the consensus determined from 18 separate sequence reactions. GenBank accession numbers of published H-2K molecules of q-, b-, k-, DBA/2 d-, and BALB/c d-haplotypes are shown in the figure. See text for further details.
Figure 4
Figure 4
Full-length cDNA sequence of BALB/c-like H-2Kd heavy chains in STO (S, SIM; T, 6-thioguanine resistant; O, ouabain resistant) and STO cell-derived (SCD) cells. (a) Sequencing strategy diagram. To obtain full-length open reading frame cDNA sequences, mRNAs from STO, 3(8)21 and 3(8)21-enhanced green fluorescent protein (EGFP) cell extracts were amplified by reverse transcriptase–polymerase chain reaction (RT-PCR) and PCR-cloning using sense (S) and antisense (AS) primers designed from a published H-2Kd-haplotype sequence (GenBank J00402). Purified products were subjected to sequence and alignment analyses using standard procedures. 5′UTR and 3′UTR, 5′ and 3′ untranslated regions, respectively. (b) Experimental sequence. The experimental sequence (top row) reflects the consensus determined from six separate sequencing reactions (one S and AS strand per cell line). The predicted amino acid sequence (single letter code) is given above each codon. See text for further details.
Figure 5
Figure 5
Quantification of H-2Kd and β2 microglobulin (β2m) mRNAs in STO (S, SIM; T, 6-thioguanine resistant; O, ouabain resistant) and STO cell-derived (SCD) cells. Relative mRNA levels in poly (A)+ RNA extracts were analysed by quantitative reverse transcriptase-mediated polymerase chain reaction (QPCR) using three different exon-specific H-2Kd mRNA primer sets (R1, R2 and R3) and one exon-specific primer set for invariant β2m mRNA. Histogram bar colours (see key) represent the following cell sources: positive-control BALB/c splenocytes (brown) and kidney tissue (orange), STO (olive), 3(8)21 (green), 3(8)21-enhanced green fluorescent protein (EGFP) (turquoise), negative-control Swiss NIH3T3 (blue) and non-specific control embryonic human 293 cells (purple). The results, normalized to GAPDH mRNA levels, are the averages of two experiments; error bars reflect deviations from the mean value. See text for further details.
Figure 6
Figure 6
Relative sizes and cellular levels of H-2Kd heavy chain proteins in STO (S, SIM; T, 6-thioguanine resistant; O, ouabain resistant) and STO cell-derived (SCD) cells. Proteins were separated by 12·5% (a), 10% (b) and 10% (c) sodium dodecyl sulphate–polyacrylamide gel electrophoresis (SDS-PAGE) under denaturing conditions and subjected to western blots. For gel loading controls, commercially supplied anti-gp96 antisera were used; immunoblotted proteins were revealed by chemiluminescence (film exposure times were 30 seconds). Arrows indicate relative molecular mass (Mr) values in kDa as determined from electrophoresed protein standards (not shown). (a) Qualitative detection with major histocompatibility complex (MHC) class I antiserum p8. The following extracts (unless noted, 18·5 µg protein/lane) were analysed (left to right): MHC class I (Kb/Db–/–) and class II knockout mice (lanes 1 and 2), which served as negative and positive anti-MHC class I controls, respectively; Swiss NIH3T3, STO, 3(8)21 and 3(8)21-enhanced green fluorescent protein (EGFP) cells, and 5 µg protein/lane of positive-control BALB/c splenocytes (lanes 3–7, respectively). (b) Semiquantitative detection by serial dilution with antiserum p8. Extracts (0·01, 0·05, 0·1, 0·3, 1 or 3 µg protein/lane, as indicated) from BALB/c splenocytes (top panel) and 3(8)21-EGFP cells (bottom panel) were analysed. The absolute staining intensities and the ratios of the band intensities (H2:gp96) were estimated visually, with serial dilution. No 3(8)21-EGFP band is detectable at the 0·05 µg level, whereas a band at that level is detectable in the splenocyte fraction. (c) Qualitative detection with pan-MHC class I antiserum 216F. Extracts (5, 10 or 20 µg protein/lane, as indicated) of q-haplotype Swiss NIH3T3 cells, d-haplotype STO, 3(8)21 and 3(8)21-EGFP cells, and d-haplotype BALB/c 3T3 cells and BALB/c splenocytes were analysed. See text for further details.
Figure 7
Figure 7
Visualization of H-2Kd heavy chain expression in cultured STO (S, SIM; T, 6-thioguanine resistant; O, ouabain resistant) and STO cell-derived (SCD) cells. Immunofluorescence analyses were performed on four sets of samples (left to right): positive-control d-haplotype BALB/c spleen tissue, and cultured STO, 3(8)21 and 3(8)21-EGFP cells. Three treatment groups are shown: isotype control + R-PE-labelled secondary antibody (a, b); R-PE-labelled secondary antibody alone (c, d); and primary anti-H-2Kd antibody plus R-PE-labelled secondary antibody (e, f). Identical microscopic fields are shown (bar, 100 µm): phase (a, c, e) or immunofluorescence (b, d, f). See text for further details.
Figure 8
Figure 8
Analysis of major histocompatibility complex (MHC) class I and class II expression on cell surfaces in STO (S, SIM; T, 6-thioguanine resistant; O, ouabain resistant) and STO cell-derived (SCD) cells. Untreated (−) or interferon (IFN)-γ-treated (+) cultured cells were incubated with either isotype control antibodies (shaded dark blue curves) or antigen-specific antibodies (unshaded green curves), and the cell suspensions were subjected to flow cytometry [H-2Ld antigen expression was analysed with R-PE-labelled primary antibody; R-PE-labelled secondary anti-mouse immunoglobulin G (IgG) antibodies were used for specific antigen detection and for isotype monitoring in the remaining groups]. Untreated BALB/c splenocytes were used as positive controls to validate MHC marker reactivities. EGFP, enhanced green fluorescent protein. See text and Table 2 for further details.
Figure 9
Figure 9
Analysis of cell differentiation (CD) marker expression on cell surfaces in STO (S, SIM; T, 6-thioguanine resistant; O, ouabain resistant) and STO cell-derived (SCD) cells. Untreated (−) or interferon (IFN)-γ-treated (+) cultured cells were incubated with either isotype control antibodies (shaded dark blue curves) or antigen-specific antibodies (unshaded green curves), and the cell suspensions were subjected to flow cytometry [primary R-PE-labelled antibody was used for specific antigen detection; R-PE-labelled anti-mouse immunoglobulin (IgG) antibodies were used to monitor isotype controls]. Untreated BALB/c splenocytes were used as positive controls to validate individual CD marker reactivities. See text and Table 2 for further details.

Similar articles

Cited by

References

    1. Auchincloss H., Jr In search of the elusive Holy Grail: the mechanisms and prospects for achieving clinical transplantation tolerance. Am J Transplant. 2001;1:6–12. - PubMed
    1. Kamradt T, Mitchison NA. Tolerance and autoimmunity. N Engl J Med. 2001;344:655–64. - PubMed
    1. Bellingham RE, Brent L, Medawar PB. ‘Actively acquired tolerance’ of foreign cells. Nature. 1953;172:603–6. - PubMed
    1. Liechty KW, MacKenzie TC, Shaaban AF, Radu A, Mosely AM, Deans R, Marshak DR, Flake AW. Human mesenchymal stem cells engraft and demonstrate site-specific differentiation after in utero transplantation in sheep. Nature Med. 2000;6:1282–6. - PubMed
    1. Taylor AW, Streilein JW. Inhibition of antigen-stimulated effector T cells by human cerebrospinal fluid. Neuroimmunomodulation. 1996;3:112–8. - PubMed

Publication types

MeSH terms