Cluster analysis of protein array results via similarity of Gene Ontology annotation
- PMID: 16836750
- PMCID: PMC1539024
- DOI: 10.1186/1471-2105-7-338
Cluster analysis of protein array results via similarity of Gene Ontology annotation
Abstract
Background: With the advent of high-throughput proteomic experiments such as arrays of purified proteins comes the need to analyse sets of proteins as an ensemble, as opposed to the traditional one-protein-at-a-time approach. Although there are several publicly available tools that facilitate the analysis of protein sets, they do not display integrated results in an easily-interpreted image or do not allow the user to specify the proteins to be analysed.
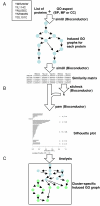
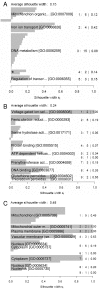
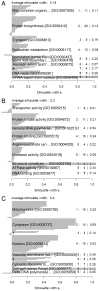
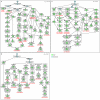
Results: We developed a novel computational approach to analyse the annotation of sets of molecules. As proof of principle, we analysed two sets of proteins identified in published protein array screens. The distance between any two proteins was measured as the graph similarity between their Gene Ontology (GO) annotations. These distances were then clustered to highlight subsets of proteins sharing related GO annotation. In the first set of proteins found to bind small molecule inhibitors of rapamycin, we identified three subsets containing four or five proteins each that may help to elucidate how rapamycin affects cell growth whereas the original authors chose only one novel protein from the array results for further study. In a set of phosphoinositide-binding proteins, we identified subsets of proteins associated with different intracellular structures that were not highlighted by the analysis performed in the original publication.
Conclusion: By determining the distances between annotations, our methodology reveals trends and enrichment of proteins of particular functions within high-throughput datasets at a higher sensitivity than perusal of end-point annotations. In an era of increasingly complex datasets, such tools will help in the formulation of new, testable hypotheses from high-throughput experimental data.
Figures


Similar articles
-
Subproteomic tools to increase genome annotation complexity.Proteomics. 2008 Oct;8(20):4209-13. doi: 10.1002/pmic.200800226. Proteomics. 2008. PMID: 18814329
-
PCHM: A bioinformatic resource for high-throughput human mitochondrial proteome searching and comparison.Comput Biol Med. 2009 Aug;39(8):689-96. doi: 10.1016/j.compbiomed.2009.05.006. Epub 2009 Jun 21. Comput Biol Med. 2009. PMID: 19541297
-
GeneTools--application for functional annotation and statistical hypothesis testing.BMC Bioinformatics. 2006 Oct 24;7:470. doi: 10.1186/1471-2105-7-470. BMC Bioinformatics. 2006. PMID: 17062145 Free PMC article.
-
Data merging for integrated microarray and proteomic analysis.Brief Funct Genomic Proteomic. 2006 Dec;5(4):261-72. doi: 10.1093/bfgp/ell019. Epub 2006 May 10. Brief Funct Genomic Proteomic. 2006. PMID: 16772273 Review.
-
Protein arrays: the current state-of-the-art.Proteomics. 2003 Jan;3(1):3-18. doi: 10.1002/pmic.200390007. Proteomics. 2003. PMID: 12548629 Review.
Cited by
-
Semantic similarity in biomedical ontologies.PLoS Comput Biol. 2009 Jul;5(7):e1000443. doi: 10.1371/journal.pcbi.1000443. Epub 2009 Jul 31. PLoS Comput Biol. 2009. PMID: 19649320 Free PMC article. Review.
-
Differential regulation of the immune system in a brain-liver-fats organ network during short-term fasting.Mol Metab. 2020 Oct;40:101038. doi: 10.1016/j.molmet.2020.101038. Epub 2020 Jun 8. Mol Metab. 2020. PMID: 32526449 Free PMC article.
-
Multiconstrained gene clustering based on generalized projections.BMC Bioinformatics. 2010 Mar 31;11:164. doi: 10.1186/1471-2105-11-164. BMC Bioinformatics. 2010. PMID: 20356386 Free PMC article.
-
Biochemical and computational analysis of LNX1 interacting proteins.PLoS One. 2011;6(11):e26248. doi: 10.1371/journal.pone.0026248. Epub 2011 Nov 8. PLoS One. 2011. PMID: 22087225 Free PMC article.
-
Multi-faceted semantic clustering with text-derived phenotypes.Comput Biol Med. 2021 Nov;138:104904. doi: 10.1016/j.compbiomed.2021.104904. Epub 2021 Sep 27. Comput Biol Med. 2021. PMID: 34600327 Free PMC article.
References
-
- Christie KR, Weng S, Balakrishnan R, Costanzo MC, Dolinski K, Dwight SS, Engel SR, Feierbach B, Fisk DG, Hirschman JE, Hong EL, Issel-Tarver L, Nash R, Sethuraman A, Starr B, Theesfeld CL, Andrada R, Binkley G, Dong Q, Lane C, Schroeder M, Botstein D, Cherry JM. Saccharomyces Genome Database (SGD) provides tools to identify and analyze sequences from Saccharomyces cerevisiae and related sequences from other organisms. Nucleic Acids Res. 2004;32:D311–4. doi: 10.1093/nar/gkh033. - DOI - PMC - PubMed
-
- Hirschman JE, Balakrishnan R, Christie KR, Costanzo MC, Dwight SS, Engel SR, Fisk DG, Hong EL, Livstone MS, Nash R, Park J, Oughtred R, Skrzypek M, Starr B, Theesfeld CL, Williams J, Andrada R, Binkley G, Dong Q, Lane C, Miyasato S, Sethuraman A, Schroeder M, Thanawala MK, Weng S, Dolinski K, Botstein D, Cherry JM. Genome Snapshot: a new resource at the Saccharomyces Genome Database (SGD) presenting an overview of the Saccharomyces cerevisiae genome. Nucleic Acids Res. 2006;34:D442–5. doi: 10.1093/nar/gkj117. - DOI - PMC - PubMed
-
- Wheeler DL, Barrett T, Benson DA, Bryant SH, Canese K, Chetvernin V, Church DM, DiCuccio M, Edgar R, Federhen S, Geer LY, Helmberg W, Kapustin Y, Kenton DL, Khovayko O, Lipman DJ, Madden TL, Maglott DR, Ostell J, Pruitt KD, Schuler GD, Schriml LM, Sequeira E, Sherry ST, Sirotkin K, Souvorov A, Starchenko G, Suzek TO, Tatusov R, Tatusova TA, Wagner L, Yaschenko E. Database resources of the National Center for Biotechnology Information. Nucleic Acids Res. 2006;34:D173–80. doi: 10.1093/nar/gkj158. - DOI - PMC - PubMed
-
- Mishra GR, Suresh M, Kumaran K, Kannabiran N, Suresh S, Bala P, Shivakumar K, Anuradha N, Reddy R, Raghavan TM, Menon S, Hanumanthu G, Gupta M, Upendran S, Gupta S, Mahesh M, Jacob B, Mathew P, Chatterjee P, Arun KS, Sharma S, Chandrika KN, Deshpande N, Palvankar K, Raghavnath R, Krishnakanth R, Karathia H, Rekha B, Nayak R, Vishnupriya G, Kumar HG, Nagini M, Kumar GS, Jose R, Deepthi P, Mohan SS, Gandhi TK, Harsha HC, Deshpande KS, Sarker M, Prasad TS, Pandey A. Human protein reference database--2006 update. Nucleic Acids Res. 2006;34:D411–4. doi: 10.1093/nar/gkj141. - DOI - PMC - PubMed
-
- Wu CH, Apweiler R, Bairoch A, Natale DA, Barker WC, Boeckmann B, Ferro S, Gasteiger E, Huang H, Lopez R, Magrane M, Martin MJ, Mazumder R, O'Donovan C, Redaschi N, Suzek B. The Universal Protein Resource (UniProt): an expanding universe of protein information. Nucleic Acids Res. 2006;34:D187–91. doi: 10.1093/nar/gkj161. - DOI - PMC - PubMed
Publication types
MeSH terms
Substances
LinkOut - more resources
Full Text Sources
Research Materials

