. 2006 Jul 25;103(30):11270-5.
doi: 10.1073/pnas.0601319103. Epub 2006 Jul 12.

Real-time metabolic imaging

Affiliations

Real-time metabolic imaging

Klaes Golman et al. Proc Natl Acad Sci U S A. .

Abstract

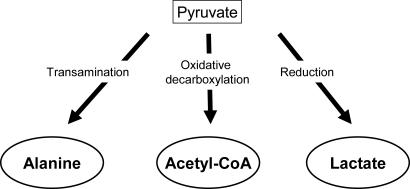
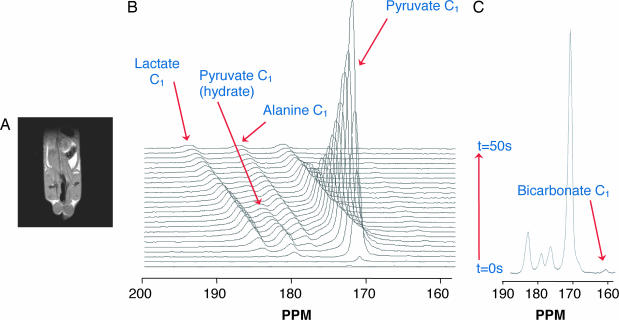
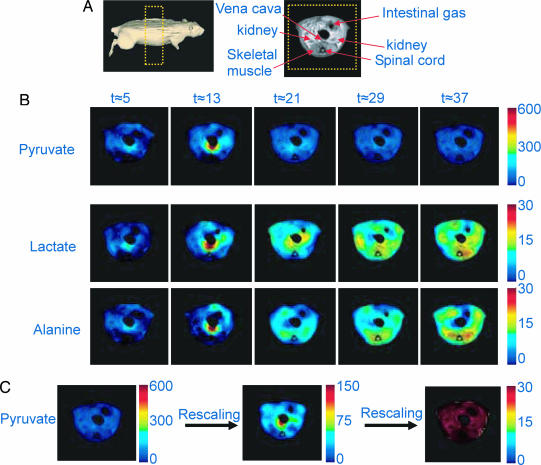
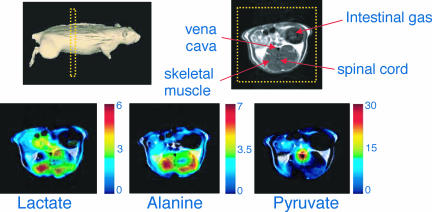
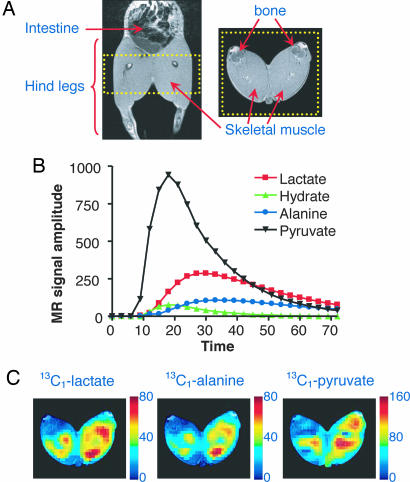
The endogenous substance pyruvate is of major importance to maintain energy homeostasis in the cells and provides a window to several important metabolic processes essential to cell survival. Cell viability is therefore reflected in the metabolism of pyruvate. NMR spectroscopy has until now been the only noninvasive method to gain insight into the fate of pyruvate in the body, but the low NMR sensitivity even at high field strength has only allowed information about steady-state conditions. The medically relevant information about the distribution, localization, and metabolic rate of the substance during the first minute after the injection has not been obtainable. Use of a hyperpolarization technique has enabled 10-15% polarization of (13)C(1) in up to a 0.3 M pyruvate solution. i.v. injection of the solution into rats and pigs allows imaging of the distribution of pyruvate and mapping of its major metabolites lactate and alanine within a time frame of approximately 10 s. Real-time molecular imaging with MRI has become a reality.


Conflict of interest statement

Conflict of interest statement: K.G., R.i.t.Z., and M.T. are employees of Amersham Health R&D AB Malmö, which is now part of GE Healthcare.

Figures

Fig. 1.
Fig. 1.
Simplified overview of the main metabolic pathways of pyruvate.
Fig. 2.
Fig. 2.
Metabolic production of lactate and alanine after the injection of 13C1-pyruvate. (A and B) The spectra (B) are acquired with a time interval of 3 s from the lower part of the animal as indicated by the proton MR image (A). (C) The formation of bicarbonate can be seen when adding all spectra.
Fig. 3.
Fig. 3.
The time course of the build up of lactate and alanine in the imaged slice of the rat. (A) The location of the image slab in the rat and the corresponding transversal 1H NMR image are illustrated. (B) The NMR signal obtained simultaneously from pyruvate, lactate, and alanine is shown. The evolution of the metabolic maps as a function of time visualizes the production of lactate and alanine in the skeletal muscle. To facilitate the interpretation, the 13C-metabolic images have been superimposed on the anatomical 1H NMR image from A. The total amplitude of pyruvate varies with a factor of 5 between the bolus passage (t = 5 s) and the final image (t = 37 s). (C) To illustrate the presence of pyruvate in the whole image (t = 37 s), the pyruvate intensity was rescaled with factors of 1, 4, and 20. The image in C Right shows the pyruvate amplitude being higher than the alanine and lactate amplitudes over the whole image.
Fig. 4.
Fig. 4.
Acquisition of a single CSI image at a higher matrix size of 16 × 16 and a field of view of 80 × 80 × 10 mm. The location of the image slab in the rat and the corresponding transversal 1H NMR image are illustrated. The NMR signal obtained simultaneously from pyruvate, lactate, and alanine also is shown. Time of acquisition is between 30 and 43 s after the start of the 12-s-long injection. The alanine production is mainly localized in the skeletal muscle.
Fig. 5.
Fig. 5.
Pyruvate and its metabolism in the hind leg of a pig. (A) Unlocalized 13C NMR spectra were acquired from the lower legs of the pig as illustrated in the proton projection image. (B) The signal amplitudes of pyruvate, pyruvate hydrate, alanine, and lactate are plotted as a function of time. (C) A separate experiment in which a chemical shift image obtained from 30 to 43 s after start of the injection maps the production of lactate and alanine in the skeletal muscle of the lower legs. To facilitate the interpretation, the 13C-metabolic images have been superimposed on the anatomical proton NMR image.

Similar articles

Cited by

References

    1. Ardenkjaer-Larsen J. H., Fridlund B., Gram A., Hansson G., Hansson L., Lerche M. H., Servin R., Thaning M., Golman K. Proc. Natl. Acad. Sci. USA. 2003;100:10158–10163. - PMC - PubMed
    1. Golman K., Ardenkjaer-Larsen J. H., Petersson J. S., Mansson S., Leunbach I. Proc. Natl. Acad. Sci. USA. 2003;100:10435–10439. - PMC - PubMed
    1. Månsson S., Johansson E., Magnusson P., Chai C. M., Hansson G., Petersson J. S., Stahlberg F., Golman K. Eur. Radiol. 2005;16:57–67. - PubMed
    1. Gadian D. G. NMR and Its Applications to Living Systems. Oxford: Oxford Univ. Press; 1995.
    1. de Graaf R. A. In Vivo NMR Spectroscopy: Principles and Techniques. London: Wiley; 1998.