. 2006 Jul 12;26(28):7424-32.
doi: 10.1523/JNEUROSCI.3062-05.2006.

Calcium spikes in basal dendrites of layer 5 pyramidal neurons during action potential bursts

Affiliations

Calcium spikes in basal dendrites of layer 5 pyramidal neurons during action potential bursts

Björn M Kampa et al. J Neurosci. .

Abstract

Patch-clamp recording from dendrites has lead to a significant increase in our understanding of the mechanisms underlying signal integration and propagation in neurons. The majority of synaptic input to neurons, however, is made onto small-diameter dendrites, currently beyond the scope of patch-clamp recording techniques. Here we use both calcium and voltage imaging to investigate propagation of action potentials (APs) in fine basal dendrites of cortical layer 5 pyramidal neurons. High-frequency (200 Hz) AP bursts caused supralinear increases in dendritic calcium at distal, but not proximal, basal locations. Supralinear increases in dendritic calcium were also observed at distal basal locations during AP trains above a critical frequency (approximately 100 Hz). Using voltage imaging, we show that single APs undergo significant attenuation as they propagate into basal dendrites, whereas AP bursts lead to generation of dendritic calcium spikes. Focal and bath application of 4-AP increased the amplitude of calcium transients evoked by APs at distal, but not proximal, locations, suggesting that A-type potassium channels regulate AP backpropagation into basal dendrites. Finally, we show that pairing EPSPs with AP bursts is an effective means of activating synaptic NMDA receptors in basal dendrites. The experimental observations on the role of A-type potassium channels in regulation of AP backpropagation in basal dendrites, as well as the generation of dendritic calcium spikes during AP bursts, were reproduced in a morphologically realistic neuronal model with uniform distributions of dendritic sodium, calcium, and potassium channels. Together, these findings have important implications for understanding dendritic integration and synaptic plasticity in cortical basal dendrites.


Figures

Figure 1.
Figure 1.
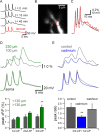
AP bursts evoke supralinear calcium rises in basal dendrites. A1, Confocal image of a layer 5 pyramidal neuron filled with OGB-1. A2, Distal region of basal dendrite indicated by rectangle in A1. Line shows location of line scans. A3, Single APs evoke similar changes in intracellular calcium in the spine (red) and dendritic branch (black). B, Changes in intracellular calcium in response to one to five APs (at 200 Hz) in basal dendrites filled with OGB-1 at the indicated locations. C, Peak ΔF/F during one (red) or three (green) APs plotted against the distance of the recording site from the soma. Lines show linear fits to the data. D, Calcium imaging of the response to one to five APs (at 200 Hz) in basal dendrites filled with OGB-6F at the indicated locations. E, Ratio of the response to three APs relative to one AP at different distances from the soma in experiments using OGB-1 and OGB-6F. Black line shows sigmoidal fit. Dashed line indicates a linear ratio. F, Calcium transients detected with OGB-1 at proximal and distal sites during trains of five APs at the indicated frequencies. G, Summary data of AP-evoked increases in calcium during trains of five APs at different frequencies. At a critical frequency above 100 Hz, AP trains induced significantly more calcium influx in distal compared with proximal basal dendrites. Data are normalized to changes in calcium at an AP frequency of 66 Hz.
Figure 2.
Figure 2.
Voltage imaging of AP backpropagation in basal dendrites. A, A three AP burst (200 Hz) recorded at the soma during filling (black traces) and after a 2 h incubation and recovery period (red trace). B, Image of proximal dendrite (average of 30 trials). Rectangle indicates ROI. C, A three AP burst recorded at the soma (black) and imaged in proximal dendrite (red) shown in B. Distance from soma was 30 μm. All data in C have been filtered at 500 Hz. D, Fluorescence changes in distal (green; 230 μm) and proximal (gray; 100 μm) basal dendrites during a three AP burst (200 Hz). Bottom traces show simultaneously recorded somatic voltage. Traces from different distances were recorded separately. Bottom, Pooled peak ΔF/F for each AP in a three AP burst at proximal (<130 μm; n = 6) and distal (>130 μm; n = 12) basal dendritic sites. The peak of the third AP was significantly larger in distal dendrites. p = 0.005. E, A three AP burst as in D in control (gray) and cadmium (200 μm; blue) recorded 200 μm from soma. Bottom, Average ratio of the third to the first AP peak in control (n = 6), cadmium (n = 6), and after washout (n = 3). p = 0.047.
Figure 3.
Figure 3.
Properties of single backpropagating APs in basal dendrites. A, Superimposed somatic voltage recording (black) and dendritic voltage imaging (gray traces). B, AP peak latency increases in a nonlinear way with distance. Line shows exponential fit. C, Dendritic AP rise time decreases with distance. Line shows sigmoidal fit.
Figure 4.
Figure 4.
AP backpropagation in distal basal dendrites is modulated by A-type potassium channels. A, Calcium transients evoked by single backpropagating APs in control (gray) and after bath application of 4-AP (gray) at a proximal site (50 μm; A) and a distal dendritic site (204 μm; B) of the same cell. Right bar graphs summarize changes in peak calcium transients evoked by one or three APs during 4-AP application (4 mm) for proximal (<130 μm; n = 6) and distal (>130 μm; n = 13) sites. Changes in intracellular calcium were imaged with OGB-6F. C, Impact of low (100 μm) concentrations of 4-AP. Left, Calcium transients evoked by single backpropagating APs at distal basal locations in control (gray) and after bath application of 100 μm 4-AP (gray). Right, Pooled data of the average change in peak calcium transients evoked by single APs in control (black) and 100 μm 4-AP (gray). Changes in intracellular calcium were imaged with OGB-1.
Figure 5.
Figure 5.
Activation of voltage-gated sodium channels in distal basal dendrites. A, Image of basal dendrite filled with OGB-6F. Line indicates location of confocal line scans, and circle shows location of focal TTX application. B, Calcium transients recorded at a distal basal site after generation of single APs in control (gray), in 4-AP (blue), and during focal application of TTX in the presence of 4-AP (red). C, Summary data showing the amplitude of AP-evoked calcium transients relative to control at distal basal locations during local application of TTX alone (yellow) and in the presence of 4-AP (brown; n = 6) during single APs (left) and three AP bursts (right). The amplitude of AP-evoked calcium transients (relative to control) at proximal apical dendritic locations during local TTX applications is shown for comparison (blue).
Figure 6.
Figure 6.
Calcium imaging pairing of AP bursts with EPSPs. A, Image of a layer 5 pyramidal neurons filled with OGB-6F (soma at bottom right). The location of a line scan through a basal dendrite is indicated by the white bar. The extracellular stimulation pipette (red) is positioned in close proximity (<10 μm) to the site in which calcium transients were recorded. B, Dendritic calcium transients (ΔF/F; average of 3 trails) after extracellular stimulation of EPSPs alone (blue), three APs alone (red; 200 Hz), or during pairing of EPSPs and AP bursts at +10 ms (green; middle AP) imaged in a basal dendrite 175 μm from the soma with OGB-6F. Somatic voltage during EPSP/AP pairing is also shown (black). Arrows indicate EPSP onset. Gray traces show the linear sum of the EPSP plus AP response. C, Increase in dendritic calcium (ΔF/F) after stimulation of EPSPs alone (blue), three APs alone (red), or during EPSP/AP pairing at +10 ms (green) in control (top) or in the presence of APV (50 μm; bottom) imaged in a basal dendrite 80 μm from the soma. EPSP response and supralinear increase during pairing are blocked by APV (50 μm).
Figure 7.
Figure 7.
Simulation of AP backpropagation in basal dendrites in a model. A, Image of compartmental model of a layer 5 pyramidal neuron showing the basal dendrites. Circles indicate a proximal (red; 48 μm) and distal (green; 204 μm) dendritic location. B, A-type potassium currents (IA) reduce AP amplitude in distal basal dendrites. B1, Waveform of single AP at the soma (thin lines) and at a distal dendritic location (204 μm from soma; thick lines) in control (gray traces) and after removal of IA channels (blue traces). B2, AP amplitude along a basal dendritic branch with (gray symbols) and without (blue symbols) IA. C, Calcium electrogenesis in basal dendrites. C1, Somatic (black) and dendritic AP waveforms (red, proximal; green, distal, as indicated in A) during a three AP burst (200 Hz) under control conditions (top) and after removal of T-type and high-voltage-activated calcium channels from basal dendrites (bottom). Compare with Figure 2, D and E. C2, Intracellular calcium concentration at the basal dendritic locations indicated in A during trains of one to five APs (200 Hz; color-coded traces). Somatic voltage is shown below. Compare with Figure 1D. C3, Ratio of the peak calcium transient evoked by three APs relative to one AP at different distances from the soma. Compare with Figure 1E. Black line shows sigmoidal fit. Dashed line indicates a linear ratio. D1, Dendritic AP waveforms during three AP bursts (200 Hz) in models with different inactivation time constants of IA. Recorded 204 μm from the soma. D2, Plot of voltage and calcium integral during AP bursts versus IA inactivation time constant (relative to control) for data like that in D1.

Similar articles

Cited by

References

    1. Antic SD (2003). Action potentials in basal and oblique dendrites of rat neocortical pyramidal neurons. J Physiol (Lond) 550:35–50. - PMC - PubMed
    1. Bekkers JM (2000). Distribution and activation of voltage-gated potassium channels in cell-attached and outside-out patches from large layer 5 cortical pyramidal neurons of the rat. J Physiol (Lond) 525:611–620. - PMC - PubMed
    1. Bi G-Q, Poo M-M (1998). Synaptic modifications in cultured hippocampal neurons: dependence on spike timing, synaptic strength, and postsynaptic cell type. J Neurosci 18:10464–10472. - PMC - PubMed
    1. Bliss TV, Collingridge GL (1993). A synaptic model of memory: long-term potentiation in the hippocampus. Nature 361:31–39. - PubMed
    1. Denk W, Yuste R, Svoboda K, Tank DW (1996). Imaging calcium dynamics in dendritic spines. Curr Opin Neurobiol 6:372–378. - PubMed

Publication types

LinkOut - more resources