. 2006 Jul 12;26(28):7433-43.
doi: 10.1523/JNEUROSCI.0106-06.2006.

Influence of response variability on the coding performance of central gustatory neurons

Affiliations

Influence of response variability on the coding performance of central gustatory neurons

Christian H Lemon et al. J Neurosci. .

Abstract

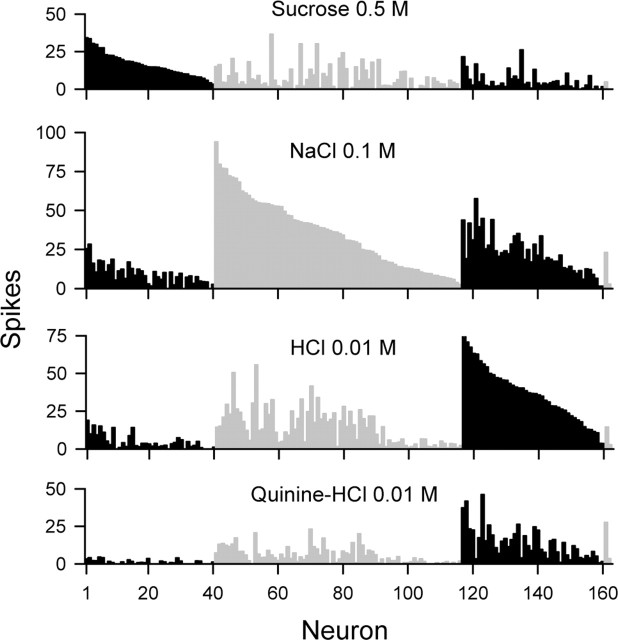
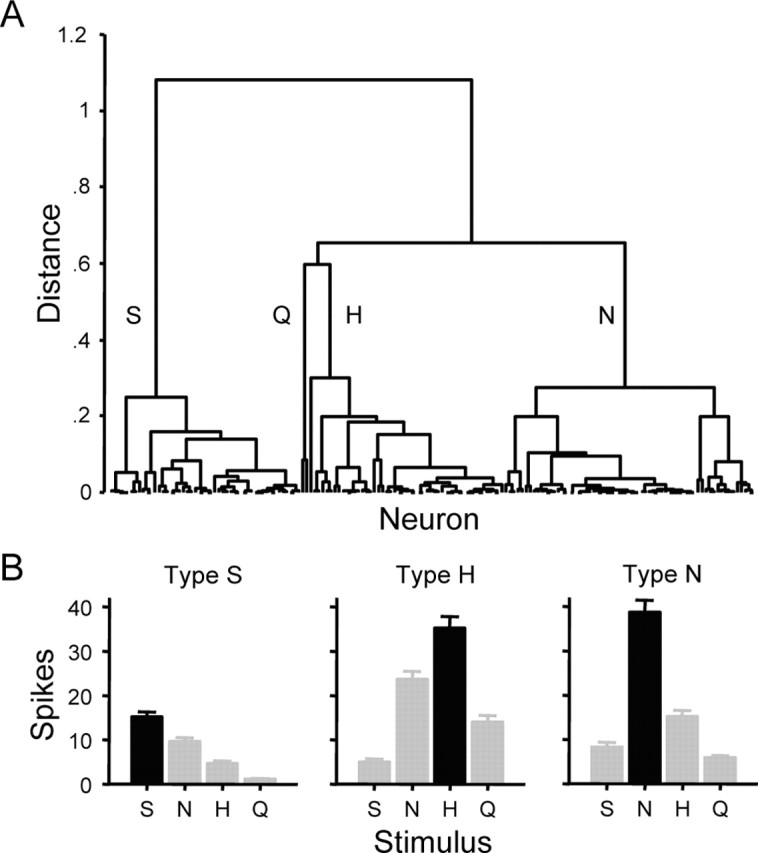
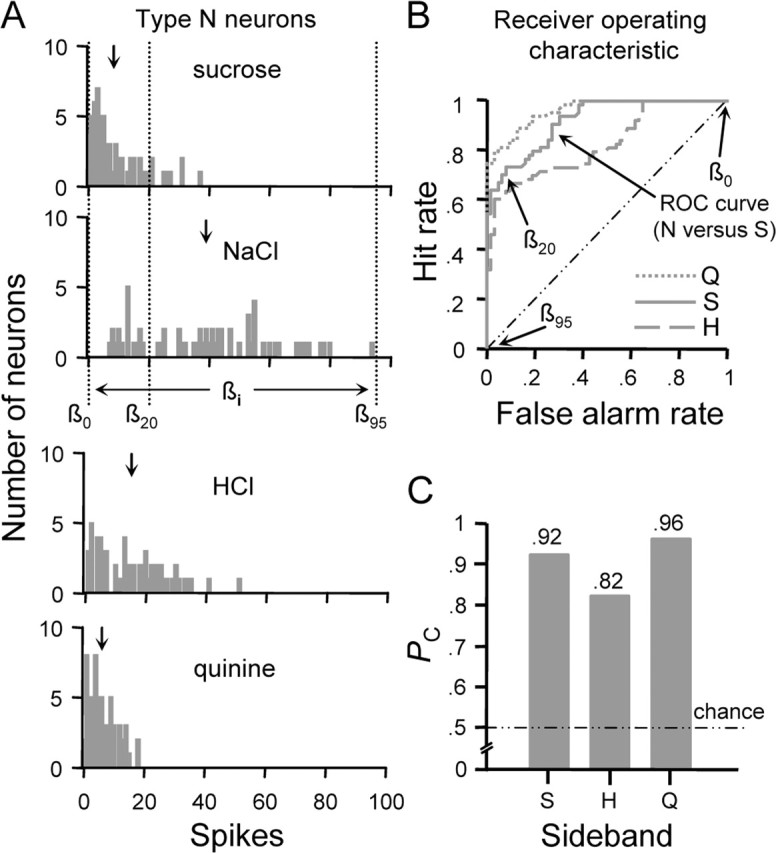
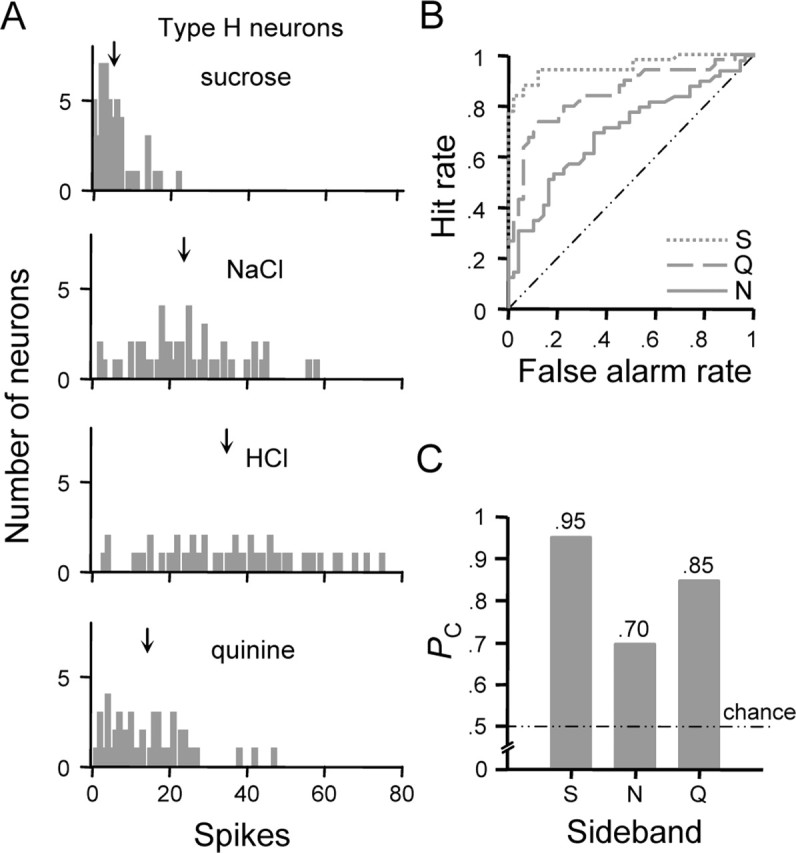
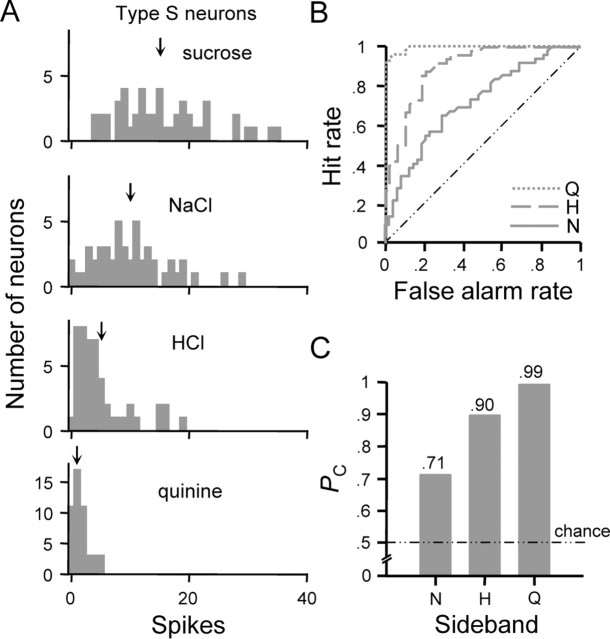
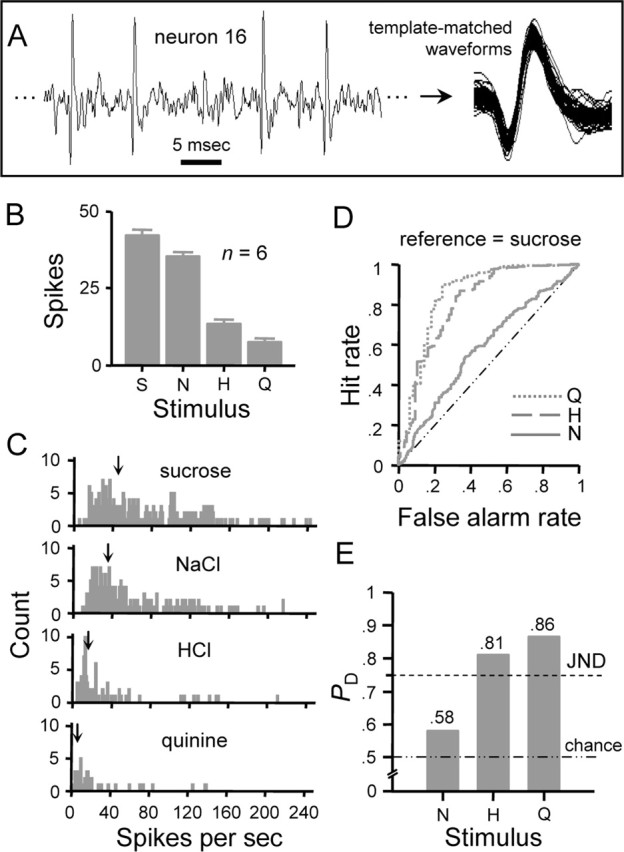
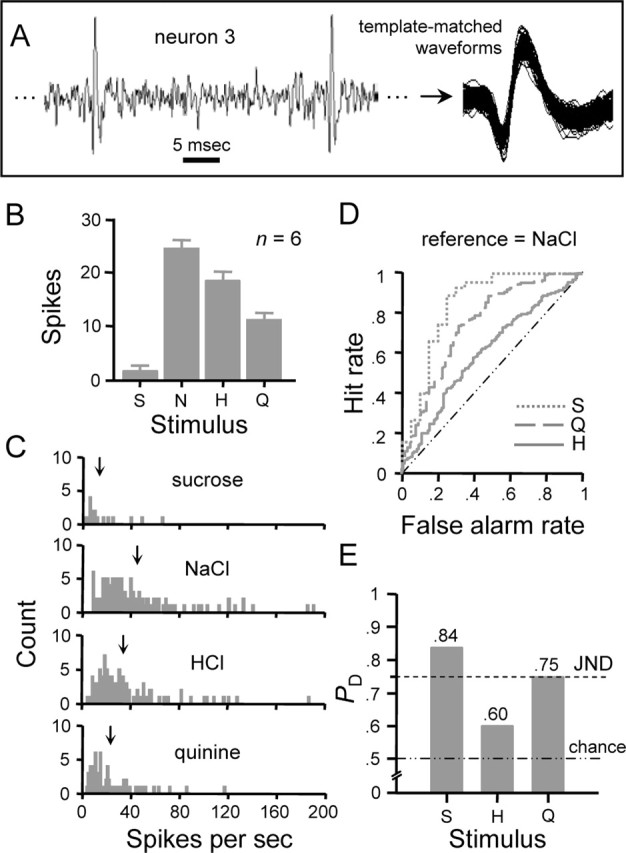
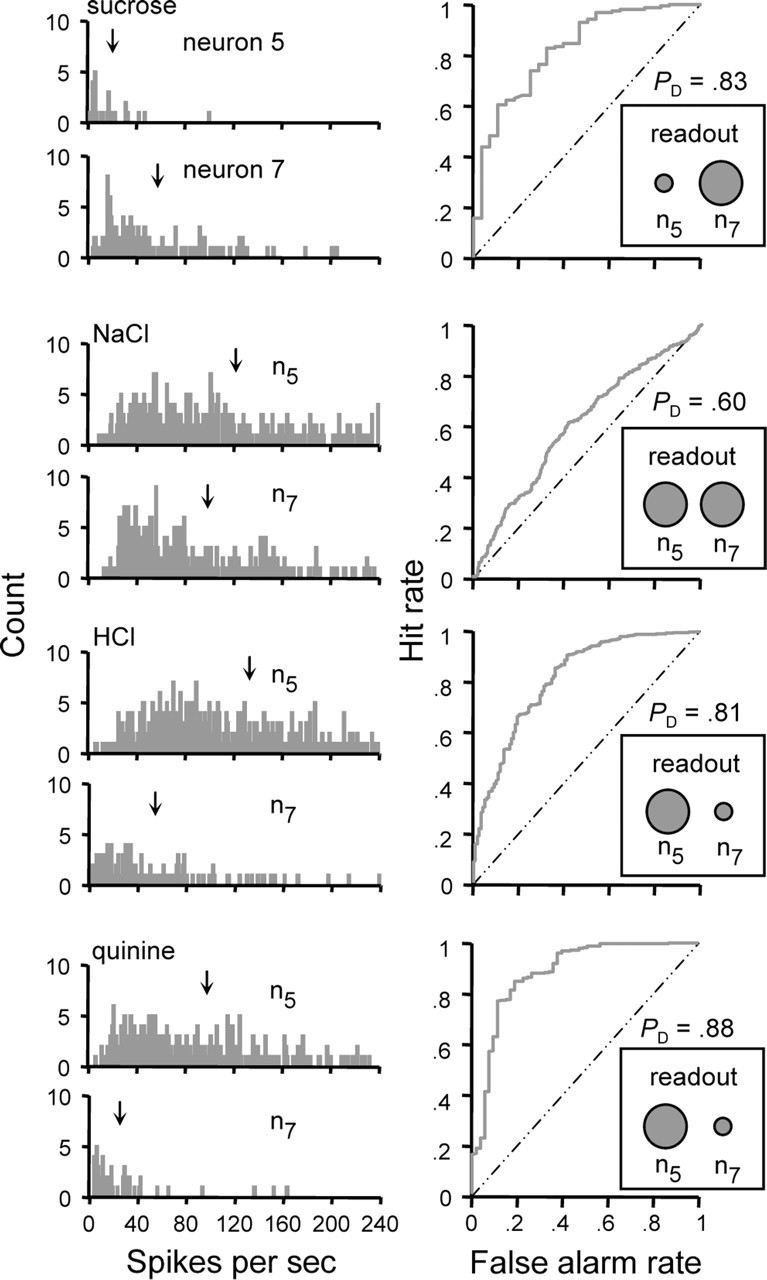
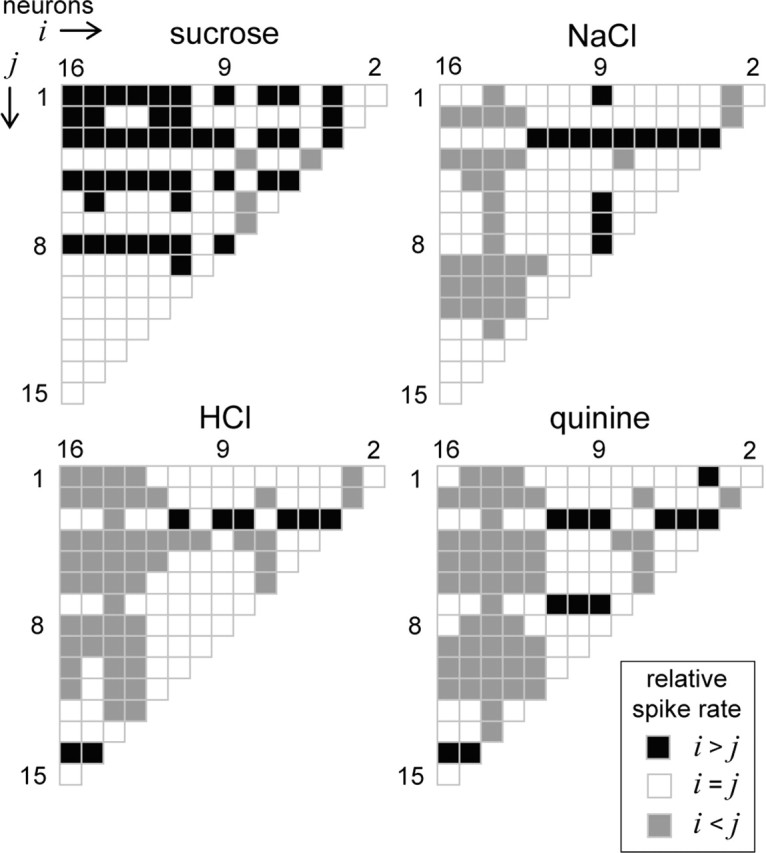
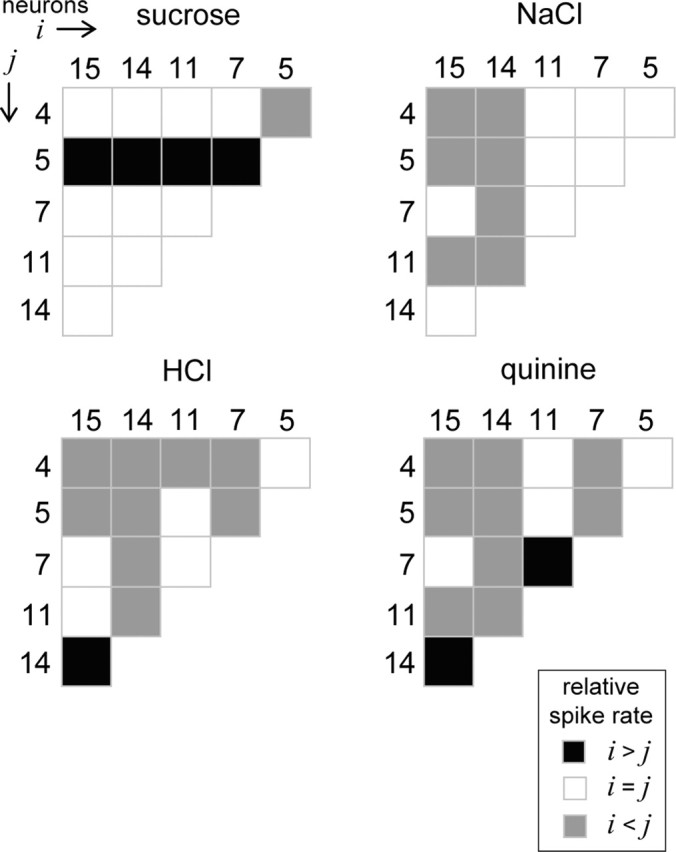
We explored how variability in responding to taste stimuli could impact the signaling of taste quality information by neuron types and individual cells in the nucleus of the solitary tract. One hundred sixty-two neurons recorded from anesthetized rats were grouped using multivariate analysis of taste responses to the following (in m): 0.5 sucrose, 0.1 NaCl, 0.01 HCl, and 0.01 quinine-HCl. Neurons fell into one of three groups corresponding to cell types that responded optimally to sucrose, NaCl, or HCl. A statistical model was used to examine whether responses observed among neurons within each group could be correctly attributed to the optimal stimulus or another tastant on the basis of spike count. Results revealed poor classification performance in some cases attributable to wide variations in the sensitivities of neurons that compose a cell type. This outcome leads us to question whether neuron types could faithfully encode a single taste quality. We then theoretically explored whether a hypothetical observer of individual neurons could discriminate between spiking rates to different tastants during the first second of stimulus processing. Spike rate was found to be an unreliable predictor of stimulus quality for each neuron tested. However, additional analyses suggested that taste stimuli could be identified by a reader that attends to the relative spiking activities of different kinds of neurons in parallel. Rather than assigning meaning to individual neurons or categories of them, central gustatory circuits may signal quality information using a strategy that involves the relative activities of neurons with different sensitivities to tastants.


Figures

Figure 1.
Figure 1.
Across-neuron patterns of response evoked by each taste stimulus across 162 NST neurons recorded from anesthetized rats. For each plot, spike count (average number in 1 s) is represented along the ordinate, and neurons are segregated from left to right along the abscissa into best-stimulus groups (sucrose-, NaCl-, HCl-, and quinine-best, respectively), as denoted by black and halftone bars. Cells are rank ordered within each group according to magnitude of responding to their best stimulus.
Figure 2.
Figure 2.
Neural groups defined using multivariate analysis. A, Dendrogram representing the results of hierarchical cluster analysis applied to categorize the neurons shown in Figure 1 into cell types based on similarities among their response profiles. Linkage distance is represented along the ordinate, and individual neurons are represented along the abscissa. Neural types defined by this analysis are denoted by labels: S, sucrose-oriented (n = 48); Q, quinine-oriented (n = 2); H, HCl-oriented (n = 49); and N, NaCl-oriented (n = 63). B, Mean responding to each stimulus in neural types S, H, and N. Bars show mean number of spikes in 1 s ± SE. Spike counts (average spikes in 1 s ± SE) follow. Neural type S: S, 15.2 ± 1.1; N, 9.6 ± 0.9; H, 4.6 ± 0.7; Q, 1.2 ± 0.2. Neural type H: S, 5.0 ± 0.7; N, 23.6 ± 1.9; H, 35.2 ± 2.6; Q, 14.0 ± 1.5. Neural type N: S, 8.3 ± 1.1; N, 38.7 ± 2.7; H, 15.1 ± 1.4; Q, 5.8 ± 0.6.
Figure 3.
Figure 3.
ROC analysis as applied to classify responses observed among type N neurons. A, Distributions showing the number of type N neurons (ordinate) that responded to each stimulus at each spike count (abscissa). Downward arrows above each distribution indicate the mean spike count across all cells. For the sucrose and NaCl distributions, three arbitrary criterion levels (β0, β20, and β95) and the range over which criteria were varied (← βi →) to compute the ROC function for this comparison are shown. B, Family of ROC curves describing the relationship between the classification hit rate (ordinate) and false alarm rate (abscissa) for responses to optimal and sideband stimuli in neural type N. Legend denotes the sideband stimulus response distribution compared with that for NaCl to compute each ROC function. Diagonal represents the ROC function that would be observed if the hit and false alarm rates were equal at each criterion. Coordinates along the ROC curve for the NaCl versus sucrose comparison that denote the hit and false alarm rates calculated at the selected values of β in A are marked by arrows. C, Profile showing probabilities (ordinate) that randomly observed responses to NaCl and a given sideband stimulus (abscissa) could be correctly classified on the basis of response amplitude. Each probability (PC) is given by the normalized area under the corresponding ROC curve in B. Chance performance (PC = 0.50) is indicated by the dotted/dashed line. S, Sucrose; H, HCl; N, NaCl; Q, quinine.
Figure 4.
Figure 4.
ROC analysis as applied to classify responses observed among type H neurons. A, Frequency distributions showing the number of neurons (ordinate) that responded to each stimulus at each spike count (abscissa). ↓, Mean spike count. B, Family of ROC curves describing the relationship between the classification hit rate (ordinate) and false alarm rate (abscissa) observed at each criterion level for responses to optimal and sideband stimuli in neural type H. Legend denotes the sideband stimulus response distribution compared with that for HCl to compute each ROC function. C, Profile showing probabilities (PC, ordinate) that randomly observed responses to HCl and a given sideband stimulus (abscissa) could be correctly classified on the basis of response amplitude. S, Sucrose; N, NaCl; Q, quinine.
Figure 5.
Figure 5.
ROC analysis as applied to classify responses observed among type S neurons. A, Frequency distributions showing the number of neurons (ordinate) that responded to each stimulus at each spike count (abscissa). ↓, Mean spike count. B, Family of ROC curves describing the relationship between the classification hit rate (ordinate) and false alarm rate (abscissa) observed at each criterion level for responses to optimal and sideband stimuli in neural type S. Legend denotes the sideband stimulus response distribution compared with that for sucrose to compute each ROC function. C, Profile showing probabilities (PC, ordinate) that randomly observed responses to sucrose and sideband stimuli (abscissa) could be correctly classified on the basis of spike count. H, HCl; N, NaCl; Q, quinine.
Figure 6.
Figure 6.
Rate coding performance of an individual NST gustatory neuron. A, Spiking activity sampled from neuron 16 (Table 1) when under gustatory drive. Spikes that arose from individual neurons were identified using a waveform template-matching algorithm. B, Response profile showing the average ± SE number of spikes produced by each stimulus in 1 s over six trials. C, Frequency distributions showing the number of observations (ordinate) of instantaneous firing rates (abscissa) to the four stimuli. Each distribution was built using sequential interspike intervals (s−1) acquired during the first second of evoked responding over six stimulus presentations. ↓, Mean spike rate. D, Family of curves describing the outcome of ROC analysis applied to pairs of distributions in C. For this neuron, the distribution produced by sucrose (i.e., the most effective stimulus) was compared with that for each secondary stimulus. Resulting ROC curves are indicated by the legend according to the secondary stimulus. Each curve describes the relationship between the hit rate (ordinate) and false alarm rate (abscissa) observed at each response criterion level. The dashed/dotted diagonal line represents the ROC curve that would be had if one distribution was compared against itself (i.e., equal hit and false alarm rates at each criterion). E, Neurometric profile showing probabilities (ordinate) that an observer of the instantaneous firing rate in this neuron could use knowledge of the means of the distributions in C to correctly discriminate between spike rates to sucrose and each secondary stimulus, which are listed along the abscissa. Each probability, PD, is given by the area under the corresponding ROC curve in D. A criterion of 75% correct discrimination (PD = 0.75) represents the JND between responses to sucrose and a secondary stimulus (dashed line). Chance discrimination performance (PD = 0.50) is indicated by the dotted/dashed line. S, Sucrose; H, HCl; N, NaCl; Q, quinine.
Figure 7.
Figure 7.
Rate coding performance of an individual NST gustatory neuron. A, Spiking activity sampled from neuron 3 (Table 1) when under taste drive. Template-matched spikes are also shown. B, Response profile showing the average ± SE number of spikes produced by each stimulus in 1 s over six trials. C, Frequency distributions of instantaneous firing rates to the four stimuli built over six presentations of each stimulus. ↓, Mean spike rate. D, Family of curves describing the outcome of ROC analysis applied to pairs of distributions in C. For this neuron, the distribution produced by NaCl was compared with that for each secondary stimulus. Resulting ROC curves are indicated by the legend according to the secondary stimulus. Each curve describes the relationship between the hit rate (ordinate) and false alarm rate (abscissa) observed at each response criterion level. E, Neurometric profile showing probabilities (ordinate) that an observer of the instantaneous firing rate in this neuron could use knowledge of the means of the distributions in C to correctly discriminate between responses to NaCl and each secondary stimulus, which are listed along the abscissa. Each probability, PD, is given by the area under the corresponding ROC curve in D. PD = 0.75, JND between responses to NaCl and a secondary stimulus (dashed line). PD = 0.50, chance discrimination performance (dotted/dashed line). S, Sucrose; H, HCl; N, NaCl; Q, quinine.
Figure 8.
Figure 8.
Decoding stimulus input by comparing firing rates between two differently tuned neurons in parallel. The left column shows frequency distributions of instantaneous firing rates to each stimulus observed for neurons 5 (n5) and 7 (n7) from Table 1. ↓, Mean spike rate. For each stimulus, ROC analysis was used to estimate the probability that a hypothetical observer of the firing rates of these neurons could use knowledge of their mean firing rates to correctly categorize responses as produced by one cell or the other. This probability, PD, is given by the area under the ROC curve. The curve computed for each stimulus is shown in the right column. The outcome of this procedure bears on if two neurons fire at similar or reliably different rates to a given stimulus. Assuming a difference threshold of 0.75, the observer could reliably discriminate between responses in neurons 5 and 7 when under the drive of sucrose (PD > 0.75). This suggests that sucrose elicits detectably different firing rates in these neurons, with n7 responding noticeably faster than n5 (i.e., n5 < n7, indicated by the size of the circles in the “readout” inset). Following this logic, n5 = n7 for NaCl, and n5 > n7 for HCl and quinine. A reader of these two neurons in parallel with a priori knowledge of the stimulus associated with each response relationship could use this information to categorize the stimuli tested here in a manner that, to a certain degree, agrees with rodent perceptual categorizations of these stimuli as shown in learned-generalization and conditioning experiments.
Figure 9.
Figure 9.
Decoding stimulus input by comparing firing rates among multiple neurons considered in parallel. Each half-matrix describes for a stimulus the pattern of relative spiking relationships that emerged across all possible pairs of NST neurons in our sample of 16 (Table 1). Neurons are sequentially ordered into vectors i and j along the columns and rows, respectively, of the half-matrices. Each matrix element is color coded to reflect the relative spiking relationship (legend) observed between a particular pair of cells, as determined by ROC analysis of spike rate distributions. For this analysis, the distribution of the neuron with the higher absolute mean spike rate was used as the reference, and the resulting probability of correct discrimination, PD, was compared with a difference threshold of 0.75 to determine the direction of the relative spiking relationship. It can be seen that sucrose, NaCl, HCl, and quinine produce unique patterns of relative spiking among these cells. A priori knowledge of the pattern of relative responding associated with each stimulus could, in principle, be used to discriminate among these stimuli.
Figure 10.
Figure 10.
Decoding stimulus input by comparing firing rates among a small number of neurons considered in parallel. Each half-matrix describes the pattern of relative spiking (legend) that was observed to sucrose, NaCl, HCl, and quinine among six neurons (Table 1; two cells were randomly drawn from each cell type) using the same approach as presented in Figure 9. As with Figure 9, a priori knowledge of the stimulus associated with each pattern of relative responding could be used to discriminate among these stimuli. However, these data show that such discriminations could, in principle, be computed making use of the activities of relatively few cells.

Similar articles

Cited by

References

    1. Adler E, Hoon MA, Mueller KL, Chandrashekar J, Ryba NJP, Zuker CS (2000). A novel family of mammalian taste receptors. Cell 100:693–702. - PubMed
    1. Bradley A, Skottun BC, Ohzawa I, Sclar G, Freeman RD (1987). Visual orientation and spatial frequency discrimination: a comparison of single neurons and behavior. J Neurophysiol 57:755–772. - PubMed
    1. Britten KH, Shadlen MN, Newsome WT, Movshon JA (1992). The analysis of visual motion: a comparison of neuronal and psychophysical performance. J Neurosci 12:4745–4765. - PMC - PubMed
    1. Chang FC, Scott TR (1984). Conditioned taste aversions modify neural responses in the rat nucleus tractus solitarius. J Neurosci 4:1850–1862. - PMC - PubMed
    1. Cheng Z, Wasserman GS (1996). Receiver operating characteristic (ROC) analysis of neural code efficacies. II. Optic nerve action potentials and neural transmission. Biol Cybern 75:105–115. - PubMed

Publication types

LinkOut - more resources