. 2006 Jul 12;26(28):7491-501.
doi: 10.1523/JNEUROSCI.0822-06.2006.

Multisensory activation of the intraparietal area when classifying grating orientation: a functional magnetic resonance imaging study

Affiliations

Multisensory activation of the intraparietal area when classifying grating orientation: a functional magnetic resonance imaging study

Ryo Kitada et al. J Neurosci. .

Abstract

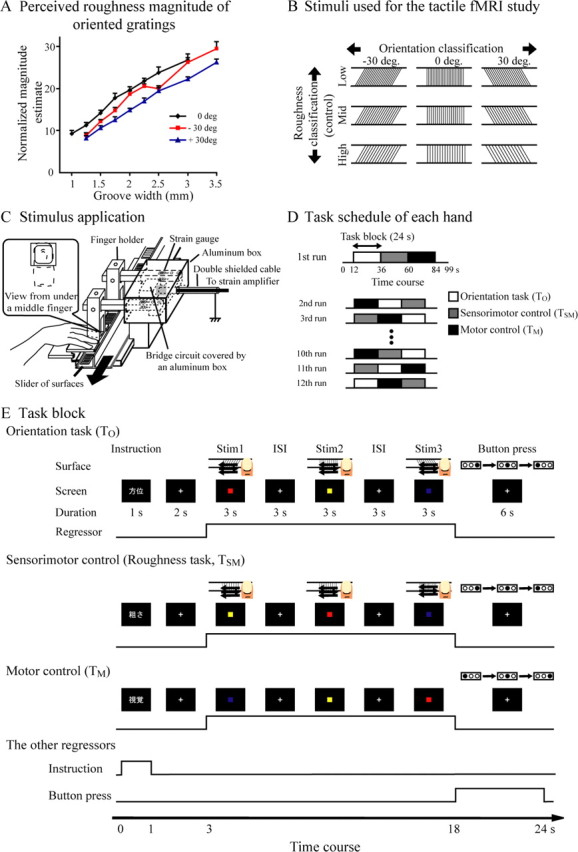
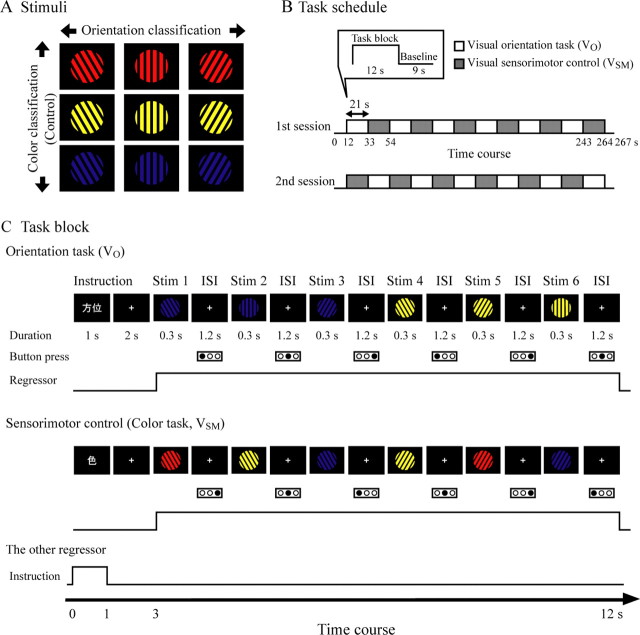
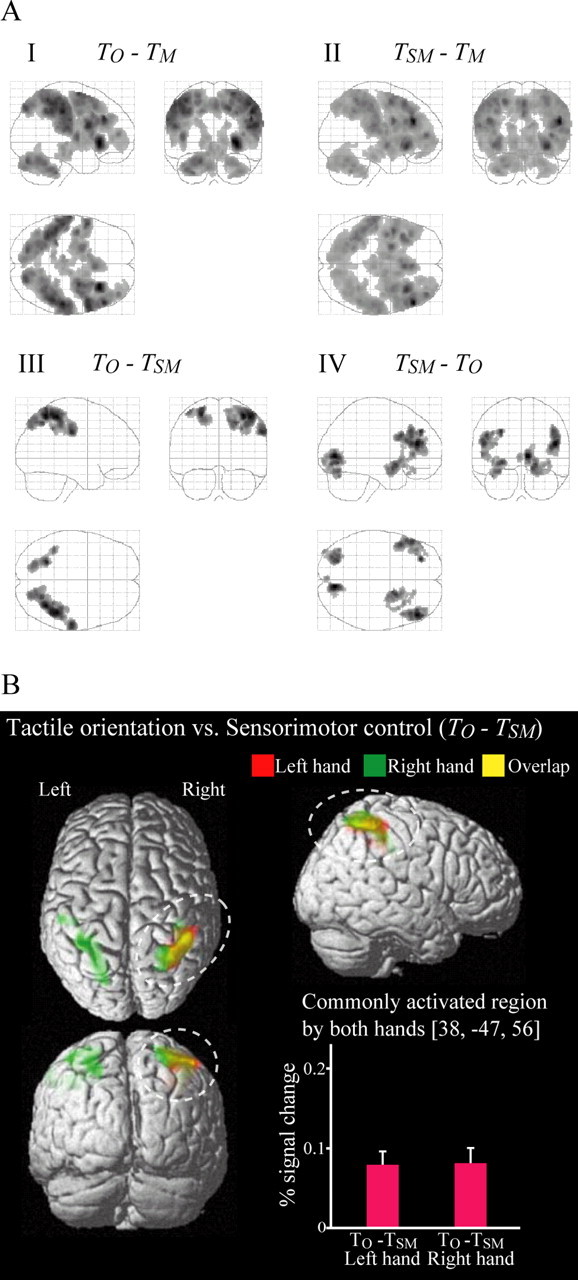
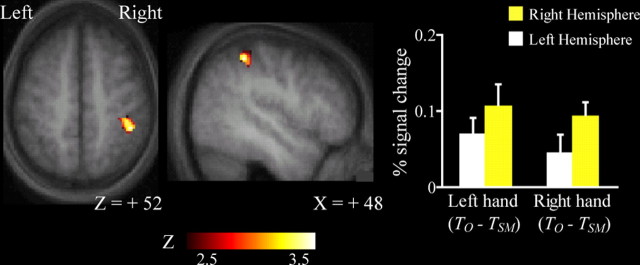
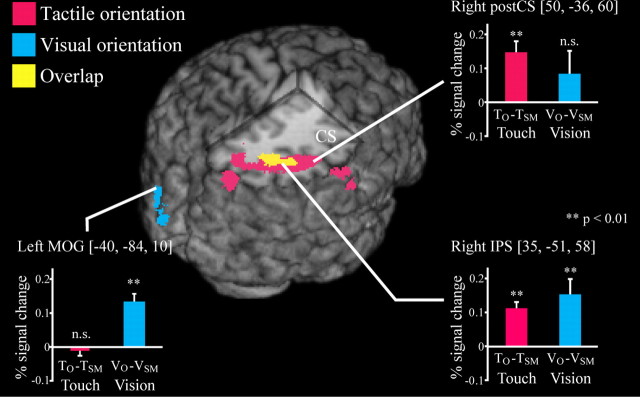
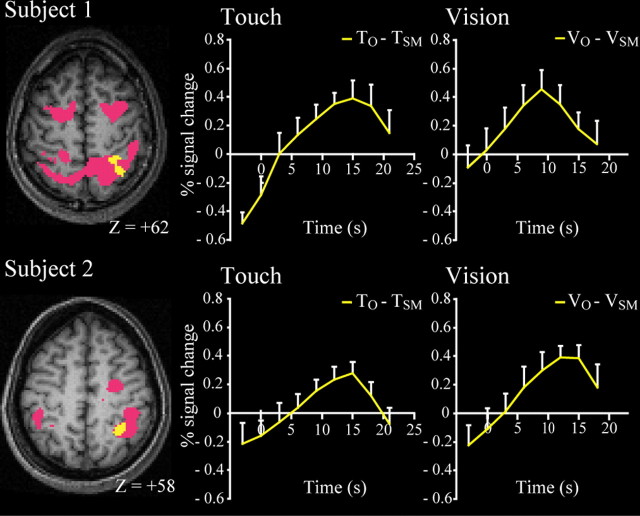
Humans can judge grating orientation by touch. Previous studies indicate that the extrastriate cortex is involved in tactile orientation judgments, suggesting that this area is related to visual imagery. However, it has been unclear which neural mechanisms are crucial for the tactile processing of orientation, because visual imagery is not always required for tactile spatial tasks. We expect that such neural mechanisms involve multisensory areas, because our perception of space is highly integrated across modalities. The current study uses functional magnetic resonance imaging during the classification of grating orientations to evaluate the neural substrates responsible for the multisensory spatial processing of orientation. We hypothesized that a region within the intraparietal sulcus (IPS) would be engaged in orientation processing, regardless of the sensory modality. Sixteen human subjects classified the orientations of passively touched gratings and performed two control tasks with both the right and left hands. Tactile orientation classification activated regions around the right postcentral sulcus and IPS, regardless of the hand used, when contrasted with roughness classification of the same stimuli. Right-lateralized activation was confirmed in these regions by evaluating the hemispheric effects of tactile spatial processing with both hands. In contrast, visual orientation classification activated the left middle occipital gyrus when contrasted with color classification of the same stimuli. Furthermore, visual orientation classification activated a part of the right IPS that was also activated by the tactile orientation task. Thus, we suggest that a part of the right IPS is engaged in the multisensory spatial processing of grating orientation.


Figures

Figure 1.
Figure 1.
The tactile tasks. A, Roughness-magnitude estimation of gratings. The two pilot psychophysical experiments were conducted to equate the magnitude of perceived roughness between the different orientations. In the conventional magnitude-estimation experiment, the oriented gratings (±30°) were perceived as smoother than the 0° gratings of the same groove width. B, Tactile stimuli. In the fMRI study, we used nine different grating surfaces, each of which had one of three different orientations (−30, 0, and +30°) and one of three different degrees of roughness. C, Apparatus for stimulation. The subjects placed their middle fingertips lightly on the surface of a slider through a bore in the plastic holder; the other fingers rested on a supporting plastic frame just above the surface. Vertical pressure was monitored by a strain gauge during the experiment. D, Task schedule. Three classification tasks were performed in a run. The order of the tasks was pseudorandomized. The subjects performed 12 runs for each hand. This procedure was repeated for both hands. Baseline periods were added before the first task and after the third task block. E, Task block. Each run consisted of three 24 s task blocks. The subjects fixated on the visual cues on the screen. The 3 s tactile stimulation (Stim) was alternated with a 3 s interstimulus interval (ISI). The subjects judged the grating orientation during the orientation task (TO), the roughness of the gratings during the sensorimotor control condition (TSM), and the color of the squares on the screen during the motor control condition (TM). The color of the squares was pseudorandomly chosen, independently of the orientation or roughness of the gratings. After the stimulation with the third surface, the subjects were asked to press three buttons in succession with the fingers of their other hand. The three buttons were aligned orthogonal to the body axis. The neural activity during the instruction periods, response periods, and three test periods were each modeled with boxcar functions. The regressors shown in the figure were convolved with a canonical hemodynamic-response function. A single task block was immediately followed by the subsequent block of another task.
Figure 2.
Figure 2.
The visual tasks. A, Visual stimuli. We used nine different images of gratings, each of which had one of three different orientations (−30, 0, and 30°) and one of three different colors (red, yellow, and blue). B, Task schedule. The two classification tasks were performed in each run. The order of the two tasks was alternated. The subjects performed two runs, each of which included six repetitions of each task. Each task block was followed by a 9 s baseline period. Baseline periods were also added before the first task block and after the final task block in a run. C, Task block. The subjects judged the orientation of the gratings during the orientation task (VO) and the color of the gratings during the sensorimotor control condition (VSM). Note that VSM is different from the tactile motor control condition (TM) in terms of the type of stimuli (Stim) presented and the timing of the responses. The subjects responded by pushing buttons with the fingers of either the left or the right hand. The subjects responded with the same buttons as in the tactile tasks. ISI, Interstimulus interval.
Figure 3.
Figure 3.
Behavioral results. A, Accuracy of performance on the tactile tasks. There was little difference between the orientation tasks and the sensorimotor control conditions; however, subjects responded more accurately during the motor control condition than during the other conditions (p < 0.001). B, Response times of the three button presses. The response times during the motor control condition were significantly shorter than during the other conditions (p < 0.001), whereas there was no significant difference between the orientation and sensorimotor control conditions. C, Vertical pressure of the middle finger. Left, An example of recordings of vertical pressure during a single run is shown. The shaded square indicates the test periods. Right, There was a significant difference in the vertical pressure applied with the left finger between the motor control and other conditions (p < 0.01). However, only negligible differences were observed between the orientation task and the sensorimotor control conditions, regardless of the hand used. These data are presented as the mean ± SEM of 16 subjects. n.s., Not significant.
Figure 4.
Figure 4.
Activation patterns in the tactile tasks. A, Statistical parametric map of the average neural activity within the group during the orientation task compared with the motor control task (TOTM), the sensorimotor control compared with the motor control task (TSMTM), the orientation task compared with the sensorimotor control (TOTSM), and the sensorimotor control compared with the orientation task (TSMTO). The three-dimensional information was collapsed into two-dimensional sagittal, coronal, and transverse images (i.e., maximum-intensity projections viewed from the right, back, and top of the brain). B, The activation patterns during the orientation task when performed with the left (red) and right (green) hands were superimposed on surface-rendered high-resolution MRIs unrelated to the subjects of the present study, viewed from the top, right, and back of the brain. The right post-CS and IPS were activated by the contrast of (TOTSM), regardless of the hand used (yellow within white dashed circle). Bar graphs indicate the difference in activity (percentage signal change) between the orientation task (TO) and sensorimotor control conditions (TSM) in the region of the right IPS, using a volume of interest with a sphere of 8 mm diameter The center of the sphere was the center of mass for the common activation during task performance with both hands. These data are presented as the mean ± SEM of 16 subjects.
Figure 5.
Figure 5.
Asymmetrical neural representation of the tactile orientation classification by either hand. The contrast images of TOTSM were compared with those flipped in the horizontal (right–left) direction in a pairwise manner (Table 1). The test was performed within the areas that revealed activation by the contrast of TOTSM. The statistical parametric map was superimposed on transverse and sagittal images, which represent the mean of the T1-weighted high-resolution MRIs for the subjects. Bar graphs indicate the difference in signal change between conditions in the right IPS and left IPS using a volume of interest with a sphere of 8 mm diameter. The centers of the spheres were the peak coordinates of activation in the right hemisphere and the flipped coordinates in the left hemisphere, respectively. These data are presented as the mean ± SEM of 16 subjects.
Figure 6.
Figure 6.
Multisensory activation in the IPS. The statistical parametric map of the average neural activity within the group during the visual orientation task compared with the activity during the sensorimotor control condition (VOVSM) were depicted within the regions activated by TOTSM in the tactile conditions. The SPM was superimposed on a surface-rendered high-resolution MRI unrelated to the subjects of the present study. Bar graphs indicate the difference in activity (percentage signal change) between the orientation task and sensorimotor control condition using a volume of interest with a sphere of 8 mm diameter. The centers of the spheres were the peak coordinates of activation. **Statistically significant difference (p < 0.01, one-sample t test). These data are presented as the mean ± SEM of 16 subjects. n.s., Not significant.
Figure 7.
Figure 7.
Individual analysis of multisensory activation in the IPS. The brain regions activated by the contrasts of VOVSM in the visual conditions were depicted (yellow area) within the regions activated by TOTSM during the tactile conditions (red area).The statistical parametric map was superimposed on the transverse plane of the T1-weighted high-resolution MRI for each subject (left column, for each subject). The percentage signal change is plotted as the mean ± SEM of 12 repetitions for each subject (right columns, for each subject). The yellow line indicates the difference in percentage signal change between the orientation task and sensorimotor control conditions. Each test period started from 0 s.

Similar articles

Cited by

References

    1. Andersen RA, Snyder LH, Bradley DC, Xing J (1997). Multisensory representation of space in the posterior parietal cortex and its use in planning movements. Annu Rev Neurosci 20:303–330. - PubMed
    1. Bodegard A, Geyer S, Grefkes C, Zilles K, Roland PE (2001). Hierarchical processing of tactile shape in the human brain. Neuron 31:317–328. - PubMed
    1. Bremmer F, Schlack A, Shah NJ, Zafiris O, Kubischik M, Hoffmann K, Zilles K, Fink GR (2001). Polymodal motion processing in posterior parietal and premotor cortex: a human fMRI study strongly implies equivalencies between humans and monkeys. Neuron 29:287–296. - PubMed
    1. Carpenter PA, Eisenberg P (1978). Mental rotation and the frame of reference in blind and sighted individuals. Percept Psychophys 23:117–124. - PubMed
    1. Corbetta M (1998). Frontoparietal cortical networks for directing attention and the eye to visual locations: identical, independent, or overlapping neural systems? Proc Natl Acad Sci USA 95:831–838. - PMC - PubMed

Publication types

LinkOut - more resources