

Theta and gamma oscillations predict encoding and retrieval of declarative memory
- PMID: 16837600
- PMCID: PMC6674196
- DOI: 10.1523/JNEUROSCI.1948-06.2006
Theta and gamma oscillations predict encoding and retrieval of declarative memory
Abstract
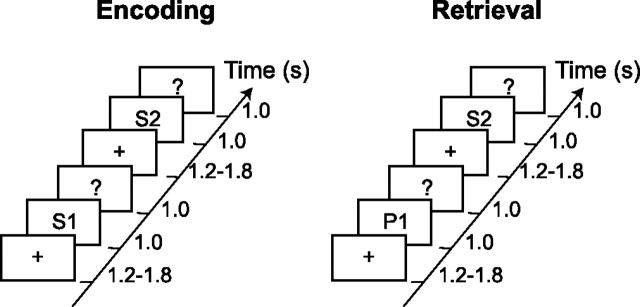
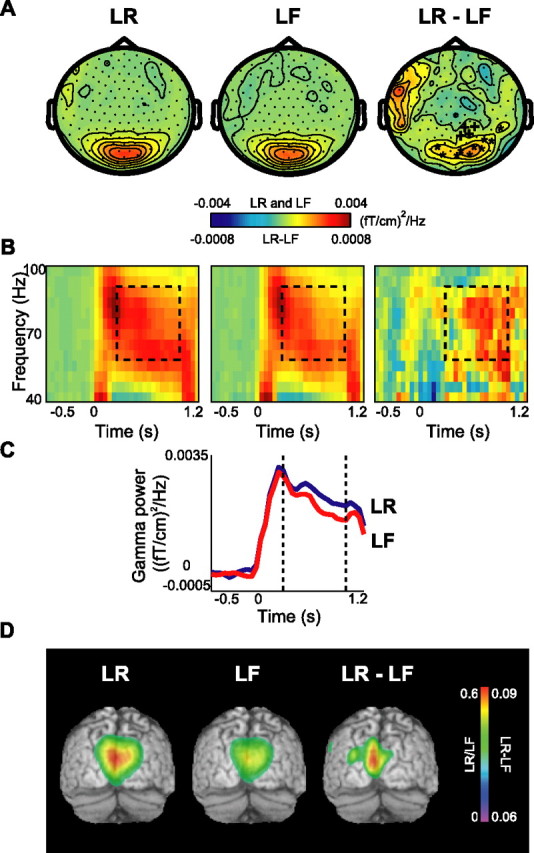
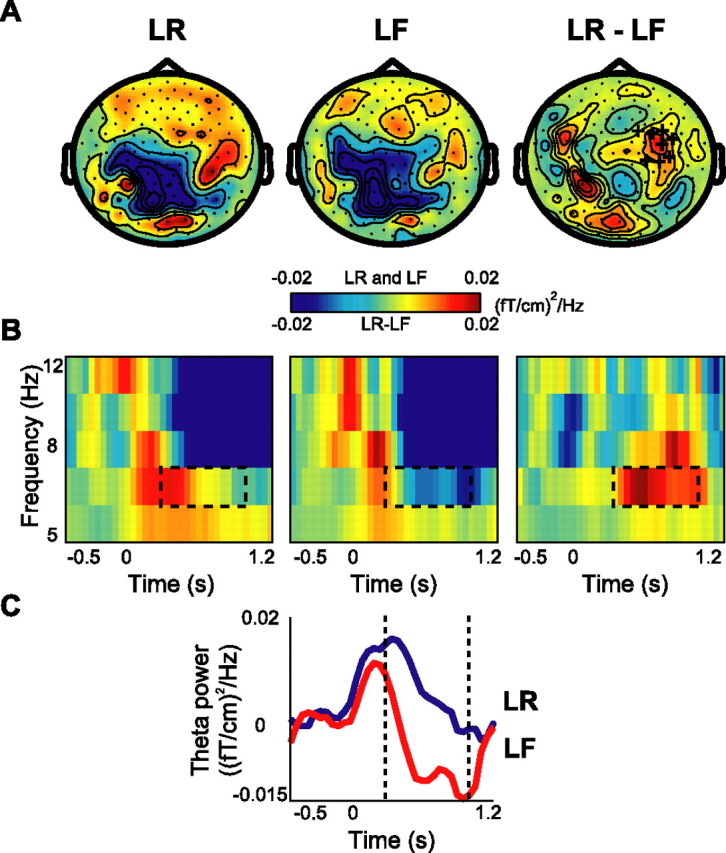
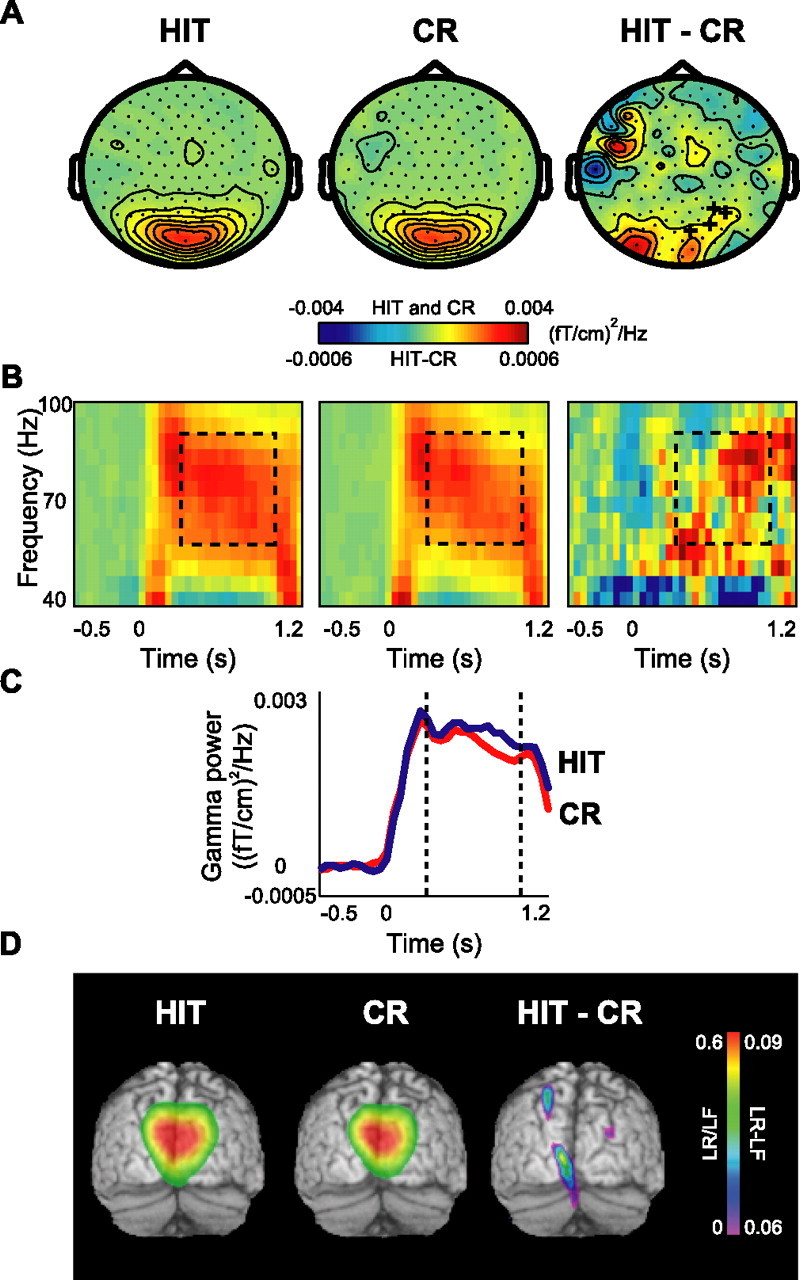
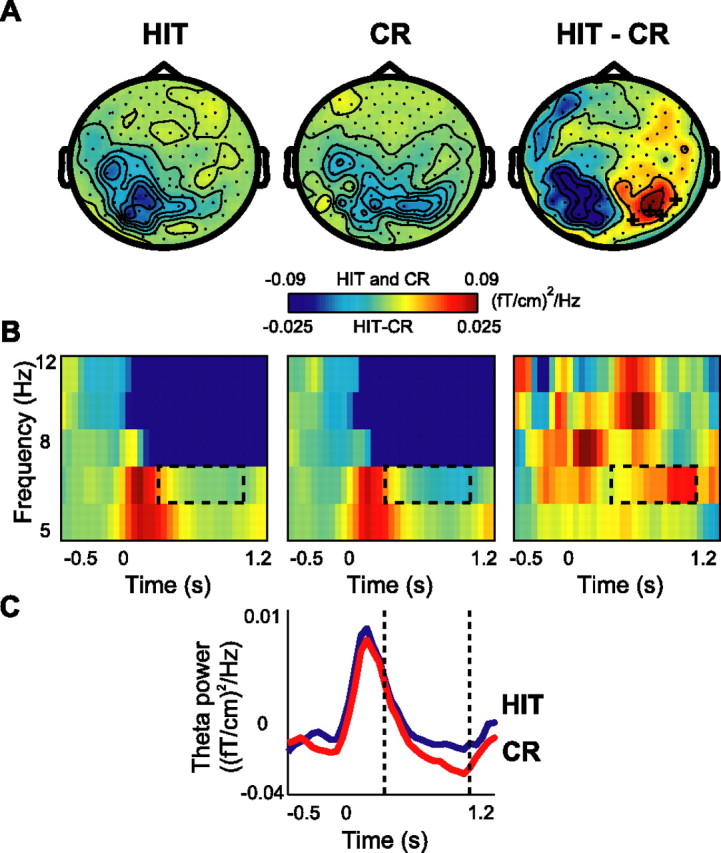
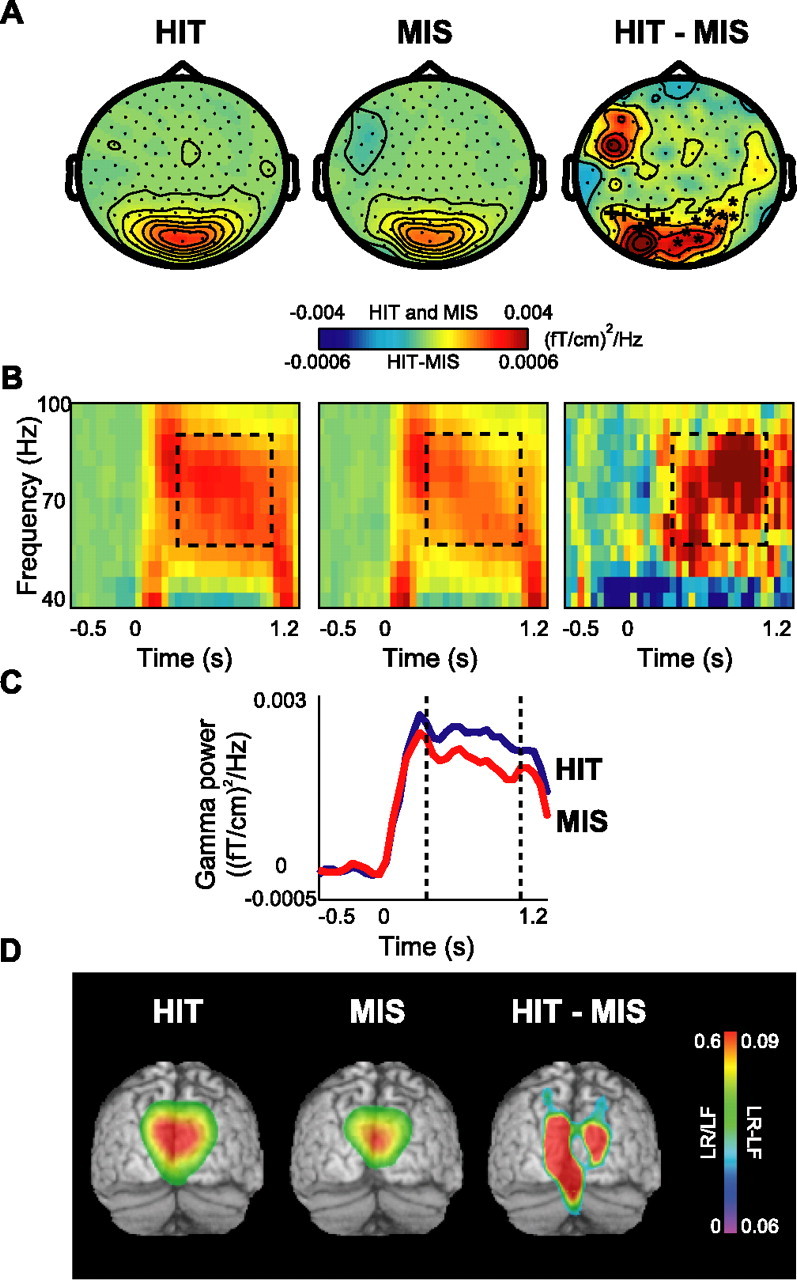
Although studies in animals and patients have demonstrated that brain oscillations play a role in declarative memory encoding and retrieval, little has been done to investigate the temporal dynamics and sources of brain activity in healthy human subjects performing such tasks. In a magnetoencephalography study using pictorial stimuli, we have now identified oscillatory activity in the gamma (60-90 Hz) and theta (4.5-8.5 Hz) band during declarative memory operations in healthy participants. Both theta and gamma activity was stronger for the later remembered compared with the later forgotten items (the "subsequent memory effect"). In the retrieval session, theta and gamma activity was stronger for recognized items compared with correctly rejected new items (the "old/new effect"). The gamma activity was also stronger for recognized compared with forgotten old items (the "recognition effect"). The effects in the theta band were observed over right parietotemporal areas, whereas the sources of the effects in the gamma band were identified in Brodmann area 18/19. We propose that the theta activity is directly engaged in mnemonic operations. The increase in neuronal synchronization in the gamma band in occipital areas may result in a stronger drive to subsequent areas, thus facilitating both memory encoding and retrieval. Alternatively, the gamma synchronization might reflect representations being reinforced by top-down activity from higher-level memory areas. Our results provide additional insight on human declarative memory operations and oscillatory brain activity that complements previous electrophysiological and brain imaging studies.
Figures
Similar articles
-
Theta-gamma coupling during episodic retrieval in the human EEG.Brain Res. 2014 Aug 19;1577:57-68. doi: 10.1016/j.brainres.2014.06.028. Epub 2014 Jun 27. Brain Res. 2014. PMID: 24978601
-
Temporal and cerebellar brain regions that support both declarative memory formation and retrieval.Cereb Cortex. 2004 Mar;14(3):256-67. doi: 10.1093/cercor/bhg125. Cereb Cortex. 2004. PMID: 14754866 Clinical Trial.
-
Induced electroencephalogram oscillations during source memory: familiarity is reflected in the gamma band, recollection in the theta band.J Cogn Neurosci. 2008 Jun;20(6):1043-53. doi: 10.1162/jocn.2008.20068. J Cogn Neurosci. 2008. PMID: 18211247
-
Induced gamma-band activity and human brain function.Neuroscientist. 2003 Dec;9(6):475-84. doi: 10.1177/1073858403259137. Neuroscientist. 2003. PMID: 14678580 Review.
-
How brain oscillations form memories--a processing based perspective on oscillatory subsequent memory effects.Neuroimage. 2014 Jan 15;85 Pt 2:648-55. doi: 10.1016/j.neuroimage.2013.05.121. Epub 2013 Jun 11. Neuroimage. 2014. PMID: 23769913 Review.
Cited by
-
Corticothalamic phase synchrony and cross-frequency coupling predict human memory formation.Elife. 2014 Dec 23;3:e05352. doi: 10.7554/eLife.05352. Elife. 2014. PMID: 25535839 Free PMC article.
-
Theta rhythm and the encoding and retrieval of space and time.Neuroimage. 2014 Jan 15;85 Pt 2(0 2):656-66. doi: 10.1016/j.neuroimage.2013.06.022. Epub 2013 Jun 14. Neuroimage. 2014. PMID: 23774394 Free PMC article. Review.
-
Correlates of Theta and Gamma Activity during Visuospatial Incidental/Intentional Encoding and Retrieval Indicate Differences in Processing in Young and Elderly Healthy Participants.Brain Sci. 2024 Aug 2;14(8):786. doi: 10.3390/brainsci14080786. Brain Sci. 2024. PMID: 39199479 Free PMC article.
-
Encoding contexts are incidentally reinstated during competitive retrieval and track the temporal dynamics of memory interference.Cereb Cortex. 2022 Nov 9;32(22):5020-5035. doi: 10.1093/cercor/bhab529. Cereb Cortex. 2022. PMID: 35106538 Free PMC article.
-
Theta-gamma coupling binds visual perceptual features in an associative memory task.Sci Rep. 2018 Dec 6;8(1):17688. doi: 10.1038/s41598-018-35812-7. Sci Rep. 2018. PMID: 30523336 Free PMC article.
References
-
- Adjamian P, Holliday IE, Barnes GR, Hillebrand A, Hadjipapas A, Singh KD (2004). Induced visual illusions and gamma oscillations in human primary visual cortex. Eur J Neurosci 20:587–592. - PubMed
-
- Baddeley A (2000). The episodic buffer: a new component of working memory? Trends Cogn Sci 4:417–423. - PubMed
-
- Brewer JB, Zhao Z, Desmond JE, Glover GH, Gabrieli JDE (1998). Making memories: brain activity that predicts how well visual experience will be remembered. Science 281:1185–1187. - PubMed
-
- Davachi L, Wagner AD (2002). Hippocampal contributions to episodic encoding: Insights from relational and item-based learning. J Neurophysiol 88:982–990. - PubMed
Publication types
MeSH terms
LinkOut - more resources
Full Text Sources
Other Literature Sources
Medical