Comparative Study
. 2006 Jul;75(1):112-25.

Competition for red blood cells can enhance Plasmodium vivax parasitemia in mixed-species malaria infections

Affiliations
Comparative Study

Competition for red blood cells can enhance Plasmodium vivax parasitemia in mixed-species malaria infections

Philip G McQueen et al. Am J Trop Med Hyg. 2006 Jul.

Abstract

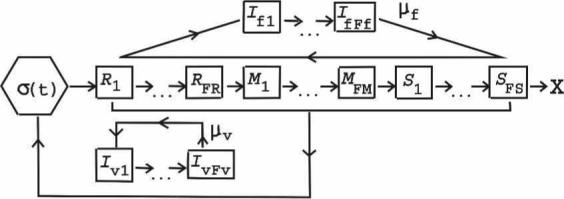
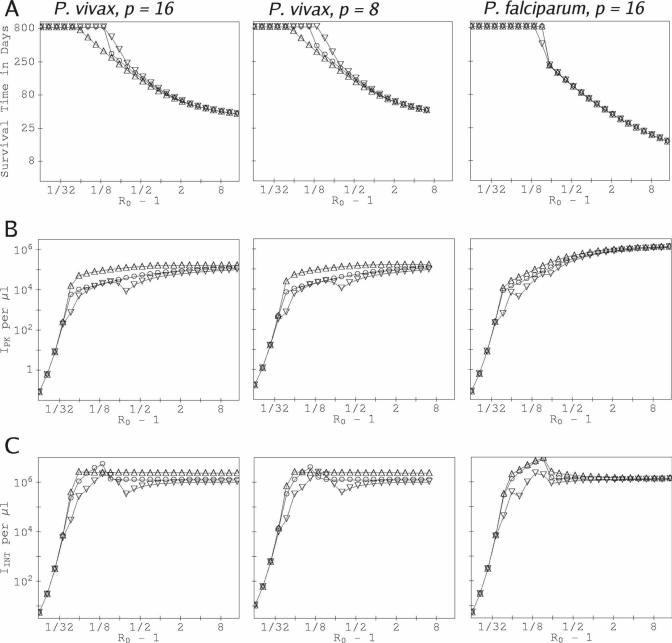
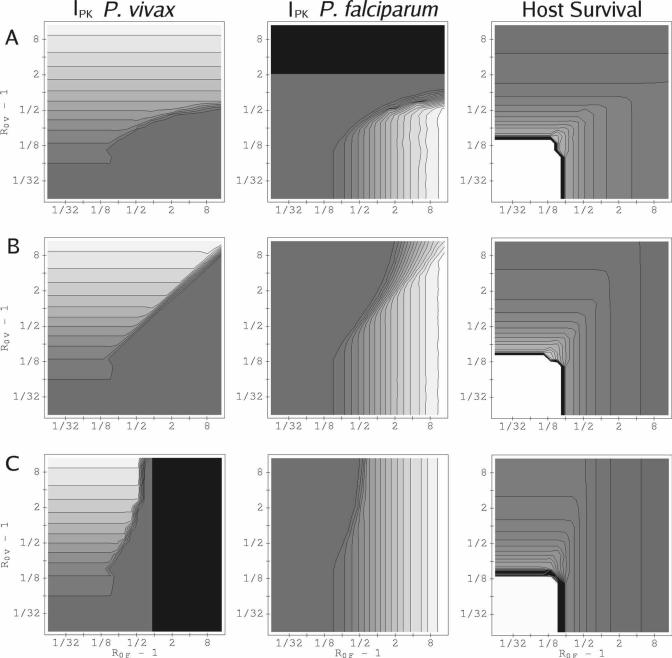
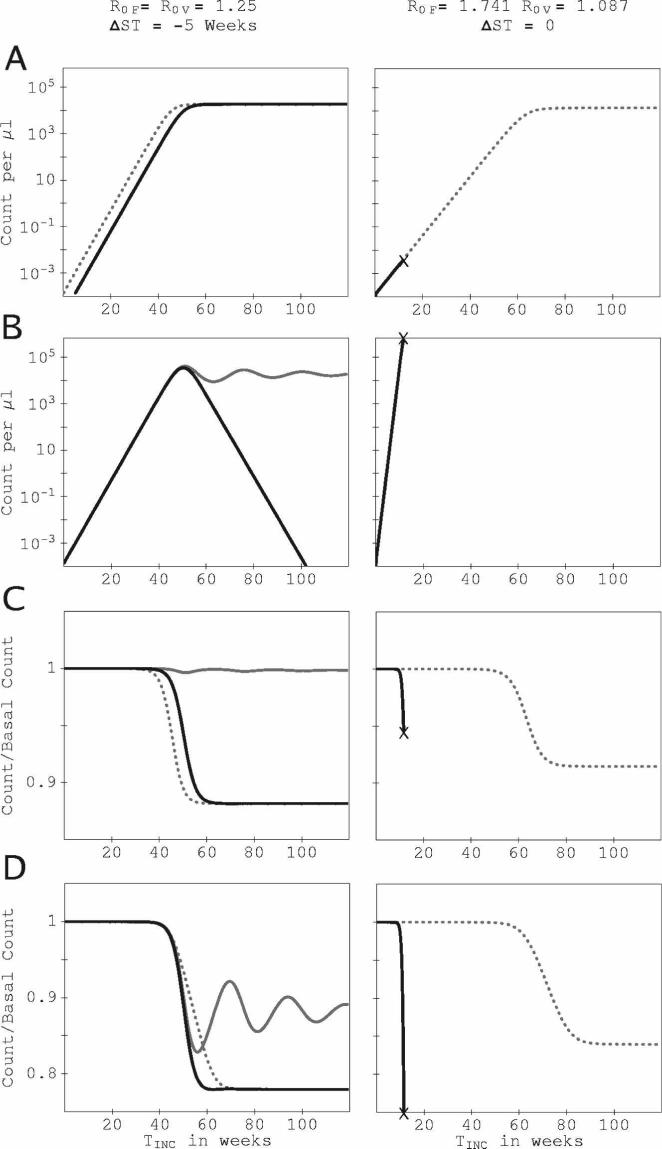
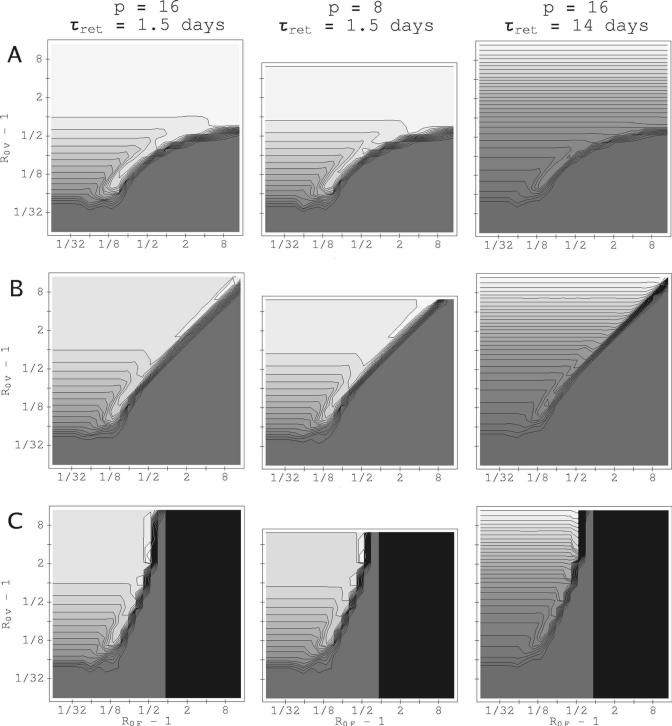
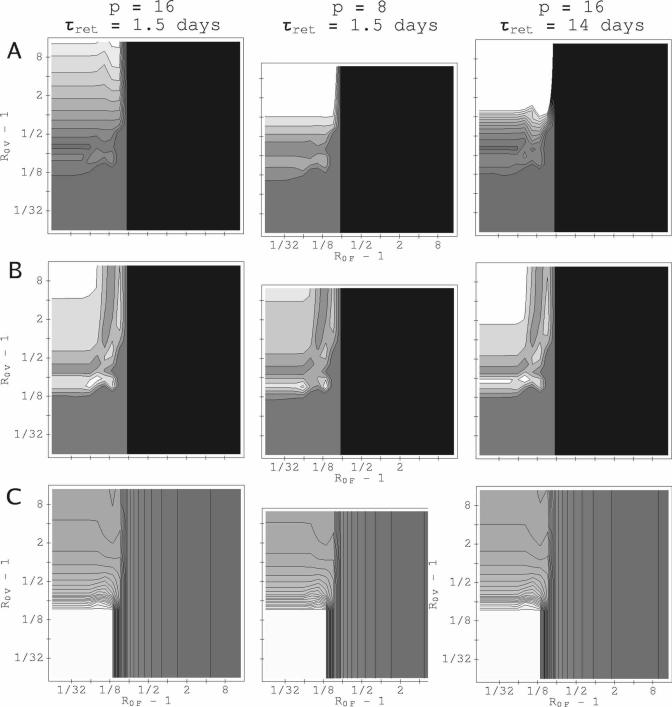
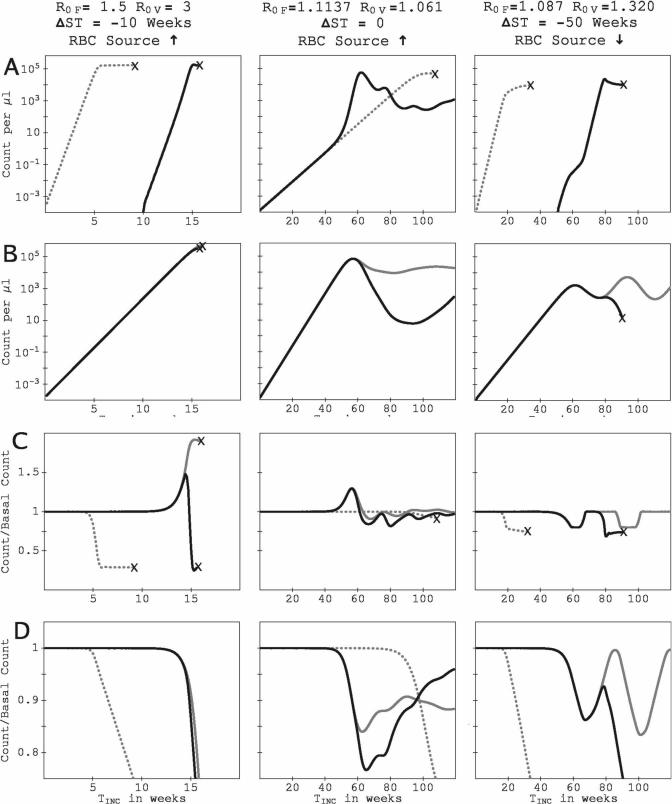
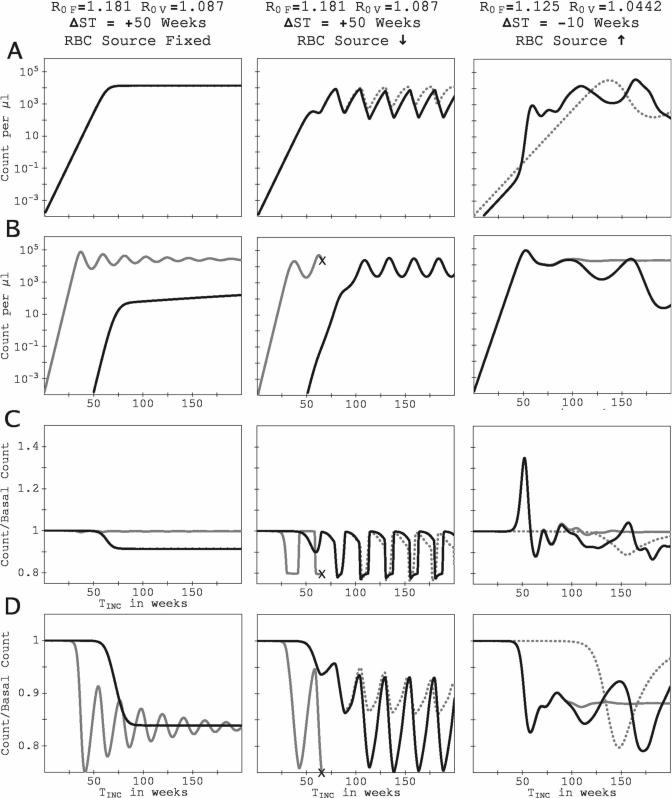
We assess the consequences of competition for red blood cells (RBCs) in co-infections with the two major agents of human malaria, Plasmodium vivax and Plasmodium falciparum, using differential equations to model the population dynamics of RBCs and parasites. P. vivax parasitizes only the youngest RBCs, but this can reduce the broader RBC population susceptible to P. falciparum. We found that competition for RBCs typically causes one species to suppress the other, depending on their relative reproduction rates and timing of inoculation. However, if the species' reproduction rates are nearly equal, transient increases in RBC production stimulated by the presence of P. falciparum may boost P. vivax parasitemia above its single-species infection level. Conversely, P. falciparum parasitemia is rarely enhanced above its single-species level. Furthermore, transients in RBC production can induce coupled oscillations in the parasitemia of both species. These results are remarkably robust to changes in model parameters.


Figures

Figure 1
Figure 1
Schematic of model dynamics. The bone marrow source of new RBCs is labeled as σ(t). RBC stages R1RFR are the reticulocytes, M1MFM are the mature stages, and S1SFS are the senescent stages (with X marking the natural end of the RBC lifespan). Only reticulocytes are vulnerable to P. vivax, but RBCs of all ages are assumed to be susceptible to P. falciparum. Iv1IvFv and If1IfFf are the RBCs infected with the developing stages of P. vivax or P. falciparum, respectively; μv and μf are the corresponding free merozoite stages. RBC production is regulated by the rate at which RBCs are lost through both normal senescence and infection; 2 × 10⁴ hours of infection are simulated in each run of the model unless the uninfected RBC count falls below 75% of its initial value (catastrophic anemia).
Figure 2
Figure 2
Outcomes for single-species infection as a function of the basic reproduction rate R0. For the p = 8 and p = 16 P. vivax curves, the duration of RBC vulnerability to infection is 1.5 days. (A) Time of onset of catastrophic anemia vs R0 with a single-species P. vivax or P. falciparum infection. Data points on the top “plateau” show where host survival exceeded the simulated duration of infection (∼ 833 days). (B) Peak counts of infected RBCs, IPK, vs R0. (C) Counts of infected RBCs integrated over the course of the infection, IINT, vs R0. In each panel, the simulated data points are labeled as follows: (○) RBC production fixed at the basal rate, (△) compensatory response in RBC production, up to two times the basal rate, and (▽) diserythropoetic response in RBC production, down to 0.8 times the basal rate.
Figure 3
Figure 3
Peak parasitemia and host survival, varying with basic reproduction rates R0V and R0F and relative inoculation time ΔST. RBC production is fixed at the basal rate. Contours for IPK for P. vivax are spaced 104 μL−1 apart; contours for IPK for P. falciparum are spaced 7.5 × 10⁴ μL−1 apart. Those for the time of onset of catastrophic anemia are spaced 25 days apart. (A) ΔST = + 10 weeks. (B) ΔST = 0. (C) ΔST = −10 weeks. The gray shading from dark gray to white is to guide the eye from minimum to maximum values. The darkest gray shows values between 0 and the first contour. Black shading shows where the host dies before the second infection begins. For both P. vivax and P. falciparum, p = 16, and the duration of RBC vulnerability to P. vivax is 1.5 days. Because of the sharp sensitivity of host survival time to R0F or R0V when R0F and R0V ∼ 1.13, the contour lines in the charts for host survival are bunched around the white plateau where the host has survived for 2 × 10⁴ hours (∼ 833 days).
Figure 4
Figure 4
Time series of parasitemia and RBC count for two examples in which one species is suppressed and the other is unaffected. All series are plotted against the time since the host was inoculated with the initial infecting species. Results in the right column are for R0F = 1.741, R0V = 1.087, ΔST = 0 (simultaneous inoculation), and in the left column for R0F = R0V = 1.25, ΔST = −5 weeks (inoculation of P. vivax 5 weeks after P. falciparum.). RBC production is fixed at the basal rate for both simulations. TINC is the time since the first inoculation. (A) Time series for the count of P. vivax–infected RBCs per microliter. (B) Time series for the count of P. falciparum–infected RBCs per microliter. (C) Time series for the ratio of the uninfected reticulocyte count to the basal reticulocyte count. (D) Times series for the ratio of the total uninfected RBC count to the basal RBC count. Solid black curves show results in the mixed-species infection, dotted curves (- - -) show the P. vivax–only infection with the corresponding R0V, gray curves show the P. falciparum–only infection with the corresponding R0F. Where a mixed-species infection curve coincides with a single-species infection curve, only the mixed-species infection curve is shown. “x” marks the onset of catastrophic anemia. For R0F = R0V = 1.25, the count of RBCs infected with P. falciparum is completely eliminated after 108 weeks.
Figure 5
Figure 5
Peak P. vivax parasitemia, varying with basic reproduction rates R0V and R0F and relative inoculation time ΔST, with a compensatory RBC source. Contours for IPK for P. vivax are spaced 104 μL−1 apart for τret = 1.5 days and 2 × 10⁴ mL−1 apart for τret = 14 days. (A) ΔST = +10 weeks. (B) ΔST = 0. (C) ΔST = −10 weeks. The gray shading from dark gray to white is to guide the eye from lowest to maximum values. The darkest gray shows values between 0 and the first contour. Black shading is where the host dies before the second infection begins. For the simulations depicted, p = 16 for P. falciparum.
Figure 6
Figure 6
P. vivax parasitemia and time of onset of catastrophic anemia, varying with basic reproduction rates R0V and R0F, with a diserythropoetic RBC source and P. falciparum infecting 50 weeks before P. vivaxST = −50). The gray shading from dark gray to white is to guide the eye from lowest to maximum values. The darkest gray shows values between 0 and the first contour. Black shading is where the host dies before the second infection begins. (A) IPK for P. vivax. Contours are spaced 104 μL−1 apart for τret = 1.5 day and 2 × 10⁴ μL−1 apart for τret = 14 day. (B) IINT for P. vivax. Contours are spaced 2.5 × 10⁵ μL−1 apart for all values of p and τret. (C) Time of onset of catastrophic anemia with first species. Contours are spaced 25 days apart. For simulations depicted, p = 16 for P. falciparum.
Figure 7
Figure 7
Time series of parasitemia and RBC count for three examples in which P. falciparum facilitates P. vivax through transient surges in the reticulocyte count. All series are plotted against TINC, the time since the host was inoculated with the initial infecting species. The left column shows system dynamics for R0F = 1.5, R0V = 3, with a compensatory response and ΔST = −10 weeks (P. falciparum infects 10 weeks before P. vivax). The middle column shows system dynamics for R0F = 1.1137, R0V = 1.061, with a compensatory response and ΔST = 0 (both species inoculated at the same time). The right column shows system dynamics for R0F = 1.087, R0V = 1.320, with a diserythropoetic response and ΔST = −50 (P. falciparum infecting 50 weeks before P. vivax). Panels and all symbols are as in Figure 4. For the three simulations, τret = 1.5 days.
Figure 8
Figure 8
Time series of parasitemia and RBC count for three examples showing long-term behavior of the model (up to 200 weeks of simulated infection). All series are plotted against TINC, the time since the host was inoculated with the initial infecting species. The left column is for R0F = 1.181, R0V = 1.087, ΔST = +50 (P. falciparum infecting 50 weeks after P. vivax), with the RBC rate of production fixed at the basal rate. The middle column is also for R0F = 1.181, R0V = 1.087, ΔST = +50 but with a diserythropoetic response. The right column is for R0F = 1.125, R0V = 1.0442, ΔST = −10 (P. falciparum infecting 10 weeks before P. vivax) with a compensatory response to the loss of RBCs caused by infection. Panels and all symbols are as in Figure 4.

Similar articles

Cited by

References

    1. White NJ, Breman JG. Malaria and babesiosis. In: Braunwald E, Fauci AS, Isselbacher KJ, Kasper DL, Hauser SL, Longo DI, Jameson JL, editors. Harrison's Principles of Internal Medicine. McGraw-Hill; New York: 2001. pp. 1203–1213.
    1. Miller LH, Baruch D, Marsh K, Doumbo OK. The pathogenic basis of malaria. Nature. 2002;415:673–679. - PubMed
    1. McKenzie FE, Bossert WH. Mixed-species Plasmodium infections of Anopheles. J Med Entomol. 1997;34:417–425. - PMC - PubMed
    1. Knowles R, White RS. Studies in the Parasitology of Malaria. Indian Med Res Memoirs No. 18. Thacker, Spink, and Co.; Calcutta, India: 1930.
    1. Cohen JE. Heterologous immunity in human malaria. Q Rev Biol. 1973;48:467–489. - PubMed

Publication types

LinkOut - more resources