

Reducing reflected contributions to ear-canal distortion product otoacoustic emissions in humans
- PMID: 16838533
- PMCID: PMC2536772
- DOI: 10.1121/1.2200048
Reducing reflected contributions to ear-canal distortion product otoacoustic emissions in humans
Abstract
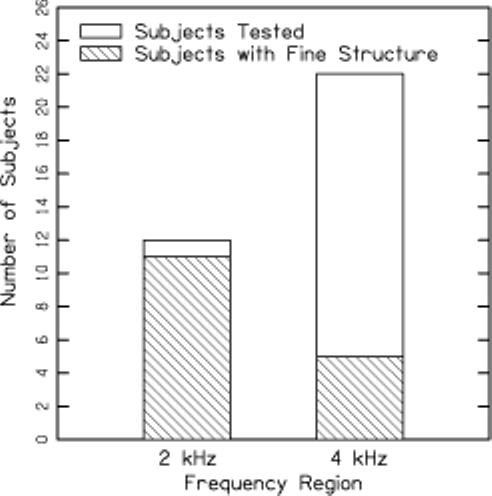
Distortion product otoacoustic emission (DPOAE) fine structure has been attributed to the interaction of two cochlear-source mechanisms (distortion and reflection sources). A suppressor presented near the 2f1-f2 frequency reduces the reflection-source contribution and, therefore, DPOAE fine structure. Optimal relationships between stimulus and suppressor conditions, however, have not been described. In this study, the relationship between suppressor level (L3) and stimulus level (L2) was evaluated to determine the L3 that was most effective at reducing fine structure. Subjects were initially screened to find individuals who produced DPOAE fine structure. A difference in the prevalence of fine structure in two frequency intervals was observed. At 2 kHz, 11 of 12 subjects exhibited fine structure, as compared to 5 of 22 subjects at 4 kHz. Only subjects demonstrating fine structure participated in subsequent measurements. DPOAE responses were evaluated in 1/3-octave intervals centered at 2 or 4 kHz, with 4 subjects contributing data at each interval. Multiple L3's were evaluated for each L2, which ranged from 20 to 80 dB SPL. The results indicated that one or more L3's at each L2 were roughly equally effective at reducing DPOAE fine structure. However, no single L3 was effective at all L2's in every subject.
Figures


Similar articles
-
Fine structure of distortion product otoacoustic emissions: its dependence on age and hearing threshold and clinical implications.Eur Arch Otorhinolaryngol. 2008 Oct;265(10):1165-72. doi: 10.1007/s00405-008-0593-0. Epub 2008 Feb 27. Eur Arch Otorhinolaryngol. 2008. PMID: 18301908
-
The influence of common stimulus parameters on distortion product otoacoustic emission fine structure.Ear Hear. 2012 Mar-Apr;33(2):239-49. doi: 10.1097/AUD.0b013e3182321da4. Ear Hear. 2012. PMID: 21918451 Clinical Trial.
-
Cochlear Mechanisms and Otoacoustic Emission Test Performance.Ear Hear. 2019 Mar/Apr;40(2):401-417. doi: 10.1097/AUD.0000000000000625. Ear Hear. 2019. PMID: 29952805 Free PMC article.
-
Evidence for the distortion product frequency place as a source of distortion product otoacoustic emission (DPOAE) fine structure in humans. I. Fine structure and higher-order DPOAE as a function of the frequency ratio f2/f1.J Acoust Soc Am. 1999 Dec;106(6):3473-83. doi: 10.1121/1.428200. J Acoust Soc Am. 1999. PMID: 10615687
-
Gender, music, and distortion product otoacoustic emission components.Ear Hear. 2013 Nov-Dec;34(6):e74-81. doi: 10.1097/AUD.0b013e31829176ac. Ear Hear. 2013. PMID: 23698624
Cited by
-
Correlation and Reliability of Behavioral and Otoacoustic-Emission Estimates of Contralateral Medial Olivocochlear Reflex Strength in Humans.Front Neurosci. 2021 Feb 16;15:640127. doi: 10.3389/fnins.2021.640127. eCollection 2021. Front Neurosci. 2021. PMID: 33664649 Free PMC article.
-
Distortion product otoacoustic emissions: cochlear-source contributions and clinical test performance.J Acoust Soc Am. 2007 Dec;122(6):3539-53. doi: 10.1121/1.2799474. J Acoust Soc Am. 2007. PMID: 18247762 Free PMC article.
-
Low-frequency modulation of distortion product otoacoustic emissions in humans.J Acoust Soc Am. 2007 Sep;122(3):1681. doi: 10.1121/1.2764467. J Acoust Soc Am. 2007. PMID: 17927428 Free PMC article.
-
Fine structure of distortion product otoacoustic emissions: its dependence on age and hearing threshold and clinical implications.Eur Arch Otorhinolaryngol. 2008 Oct;265(10):1165-72. doi: 10.1007/s00405-008-0593-0. Epub 2008 Feb 27. Eur Arch Otorhinolaryngol. 2008. PMID: 18301908
-
Distortion product otoacoustic emission phase and component analysis in human newborns.J Acoust Soc Am. 2010 Jan;127(1):316-25. doi: 10.1121/1.3268611. J Acoust Soc Am. 2010. PMID: 20058979 Free PMC article.
References
-
- ANSI . Specifications for audiometers. American National Standards Institute; New York: 1996. ANSI 3.6−1996.
-
- Boege P, Janssen T. Pure-tone threshold estimation from extrapolated distortion product otoacoustic emission I/O-functions in normal and cochlear hearing loss ears. J. Acoust. Soc. Am. 2002;111:1810–1818. - PubMed
-
- Dhar S, Shaffer LA. Effects of a suppressor tone on distortion-product otoacoustic emissions fine structure: Why a universal suppressor level is not a practical solution to obtaining single-generator DP-Grams. Ear Hear. 2004;25:573–585. - PubMed
-
- Goodman SS, Withnell RH, Shera CA. The origin of SFOAE microstructure in the guinea pig. Hear. Res. 2003;183:7–17. - PubMed
-
- Gorga MP, Neely ST, Dierking DM, Dorn PA, Hoover BM, Fitzpatrick DF. Distortion product otoacoustic emission suppression tuning curves in normal-hearing and hearing-impaired human ears. J. Acoust. Soc. Am. 2003a;114:263–278. - PubMed
Publication types
MeSH terms
Grants and funding
LinkOut - more resources
Full Text Sources
Miscellaneous