. 2006 Jul;2(7):e106.
doi: 10.1371/journal.pgen.0020106. Epub 2006 May 26.

Potent induction of Arabidopsis thaliana flowering by elevated growth temperature

Affiliations

Potent induction of Arabidopsis thaliana flowering by elevated growth temperature

Sureshkumar Balasubramanian et al. PLoS Genet. 2006 Jul.

Abstract

The transition to flowering is an important event in the plant life cycle and is modulated by several environmental factors including photoperiod, light quality, vernalization, and growth temperature, as well as biotic and abiotic stresses. In contrast to light and vernalization, little is known about the pathways that mediate the responses to other environmental variables. A mild increase in growth temperature, from 23 degrees C to 27 degrees C, is equally efficient in inducing flowering of Arabidopsis plants grown in 8-h short days as is transfer to 16-h long days. There is extensive natural variation in this response, and we identify strains with contrasting thermal reaction norms. Exploiting this natural variation, we show that FLOWERING LOCUS C potently suppresses thermal induction, and that the closely related floral repressor FLOWERING LOCUS M is a major-effect quantitative trait locus modulating thermosensitivity. Thermal induction does not require the photoperiod effector CONSTANS, acts upstream of the floral integrator FLOWERING LOCUS T, and depends on the hormone gibberellin. Analysis of mutants defective in salicylic acid biosynthesis suggests that thermal induction is independent of previously identified stress-signaling pathways. Microarray analyses confirm that the genomic responses to floral induction by photoperiod and temperature differ. Furthermore, we report that gene products that participate in RNA splicing are specifically affected by thermal induction. Above a critical threshold, even small changes in temperature can act as cues for the induction of flowering. This response has a genetic basis that is distinct from the known genetic pathways of floral transition, and appears to correlate with changes in RNA processing.


Conflict of interest statement

Competing interests. The authors have declared that no competing interests exist.

Figures

Figure 1
Figure 1. Flowering Response of Ler and Col under Different Temperature Regimens
(A) Arabidopsis thaliana strain Ler grown in 23 °C short days (left) and 27 °C short days (right). (B) Flowering time of Ler (black bars) and Col (white bars) in different conditions. Error bars indicate standard deviation.
Figure 2
Figure 2. Natural Variation in Thermal Response
(A) Mean flowering time of accessions in short days at 23 °C (black bars) and 27 °C (white bars). Error bars indicate standard deviation. All, all strains; friflc, subset of strains that have nonfunctional alleles at FRI and/or FLC; FRIFLC, subset of strains with putatively functional alleles at FRI and FLC. Student's t test shows the difference between 23 °C and 27 °C to be significant for the first two groups (p < 0.0001), but not for the last. (B) Flowering times of single and double mutants of the autonomous pathway and flc-3 at 23 °C (black bars) and 27 °C (white bars). fpa-T refers to a T-DNA allele of fpa in the Col background. Genotypes are grouped based on their genetic background, with Ler and Col controls shown to the left of each group. (C) Natural variation in the thermal sensitivity of accessions. Thermosensitivity is plotted as a function of TLN in short days at 23 °C. (D) Flowering times of temperature-insensitive accessions among strains that lack functional FRI/FLC.
Figure 3
Figure 3. Effect of FLM on Thermal Sensitivity in Short Days
(A) QTL maps of NdC RILs for TLN in 27 °C short days (red lines) and 23 °C short days (black lines) and for thermal sensitivity, as expressed by the slope of the regression line mean over the environmental mean in arbitrary units (blue lines). The phenotype data for the 23 °C map are from [24]. The prominent QTL corresponding to FLM on Chromosome 1 disappears at 27 °C, while the QTL on Chromosome 2 becomes more significant. The QTL for thermal sensitivity colocalize with FLM. A likelihood of odds threshold determined after 1,000 permutations is given. The same threshold was obtained for each of the phenotypes. (B) Thermal sensitivity of various genotypes as above. Col_F and Nd_F refers to the mean sensitivity of NdC recombinant inbred lines that are homozygous for the Col wild-type allele (Col_F) and homozygous for the Nd-1 FLM deletion (Nd_F). For comparison the sensitivity of flc-3 is shown. flm-3 is a T-DNA insertion allele at FLM locus in Col background. The last genotype is the accession Ei-6, which has the same FLM deletion as Nd-1. The effect of loss of FLM in different backgrounds varies considerably between backgrounds, indicating natural variation in this pathway.
Figure 4
Figure 4. Effect of Different Genetic Pathways on Flowering Time in 27 °C Short Days
Flowering time of mutants with defects in flowering time genes in 23 °C short days (black bars) and 27 °C short days (white bars). Ler and Col controls are included both panels. (A) Mutants with defects in the photoperiod pathway, and eds16–1. co-1 is in a mixed background of Col-0 and Ler. (B) Mutants with defects in floral integrators. ft-2 and ft-7 are two independently isolated alleles with the same mutation.
Figure 5
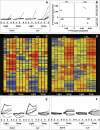
Figure 5. Genomic Responses at the Shoot Apex to Light or Temperature Treatment
For (A), (E), and (F), the day of sample collection (0, 2, 5, and 9), type of shift (light-photoperiodic shift, temp-thermal shift) and the background (Col-0 and Ler) are given in the x-axis. Log-normalized expression levels are plotted along the y-axis. The scale is the same for all three panels. (A) Response of floral marker genes (AP1, FUL, AP3, PI, AG, SEP1–3) to light and temperature shifts. (B) Principal component analysis. x-axis: first principal component explaining 39.5% of the variation, which appears to be mostly due to genetic differences between Ler and Col (indicated above). y-axis: second principal component explaining 25% of the variation. The second component mostly distinguishes light versus temperature treatment (shown to the right). (C, D) Most genes that show alterations in expression levels (significantly different between day 0 and day 9 based on logit-T) appear to be specific to the type of induction (thermal or photoperiodic). Red indicates expression levels above average across all experiments; blue, levels below average. The left panel shows genes that are induced by light (top) or repressed by light (bottom), but largely unchanged in response to temperature. The right panel shows genes with the opposite behavior. (E) Examples of light specific changes in expression profiles (CCA1, GI, COL2, SUMO3, AGL6, CRC, and TFL1). (F) As examples of temperature specific changes in expression profiles, several genes encoding SR proteins and genes associated with the Gene Ontology term “RNA processing” are shown (At2g24590, At5g46250, At1g55310, At1g09140, At1g51510 and At2g27230).

Similar articles

Cited by

References

    1. Simpson GG, Dean C. Arabidopsis, the Rosetta stone of flowering time? Science. 2002;296:285–289. - PubMed
    1. Mouradov A, Cremer F, Coupland G. Control of flowering time: Interacting pathways as a basis for diversity. Plant Cell. 2002;14(Suppl):S111–S130. - PMC - PubMed
    1. He Y, Tang RH, Hao Y, Stevens RD, Cook CW, et al. Nitric oxide represses the Arabidopsis floral transition. Science. 2004;305:1968–1971. - PubMed
    1. Martinez C, Pons E, Prats G, Leon J. Salicylic acid regulates flowering time and links defence responses and reproductive development. Plant J. 2004;37:209–217. - PubMed
    1. Korves TM, Bergelson J. A developmental response to pathogen infection in Arabidopsis . Plant Physiol. 2003;133:339–347. - PMC - PubMed

Publication types