

Human imprinted chromosomal regions are historical hot-spots of recombination
- PMID: 16839189
- PMCID: PMC1487178
- DOI: 10.1371/journal.pgen.0020101
Human imprinted chromosomal regions are historical hot-spots of recombination
Abstract
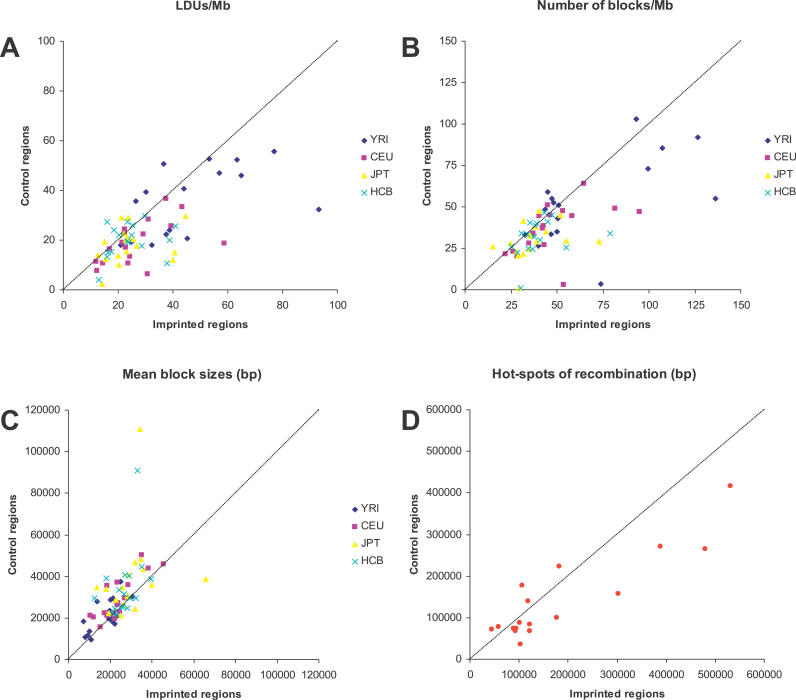
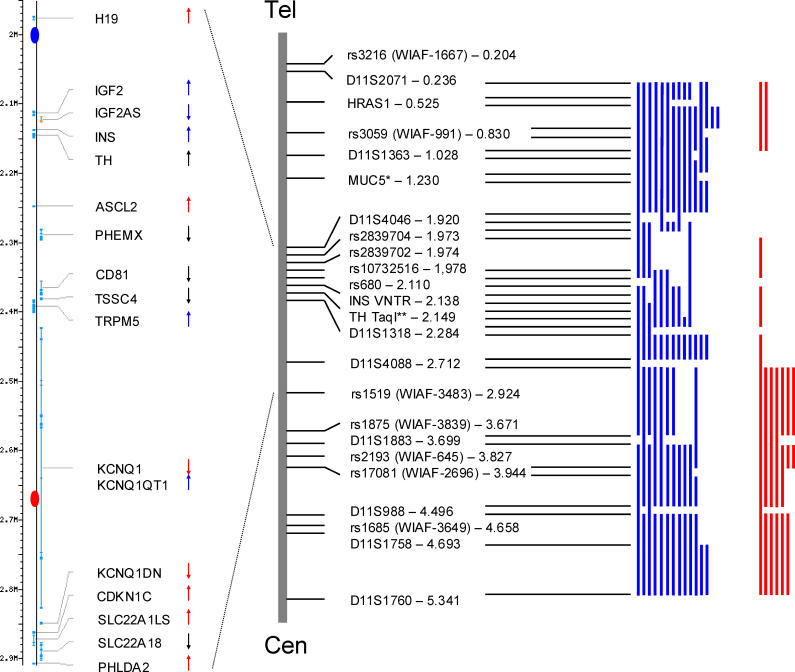
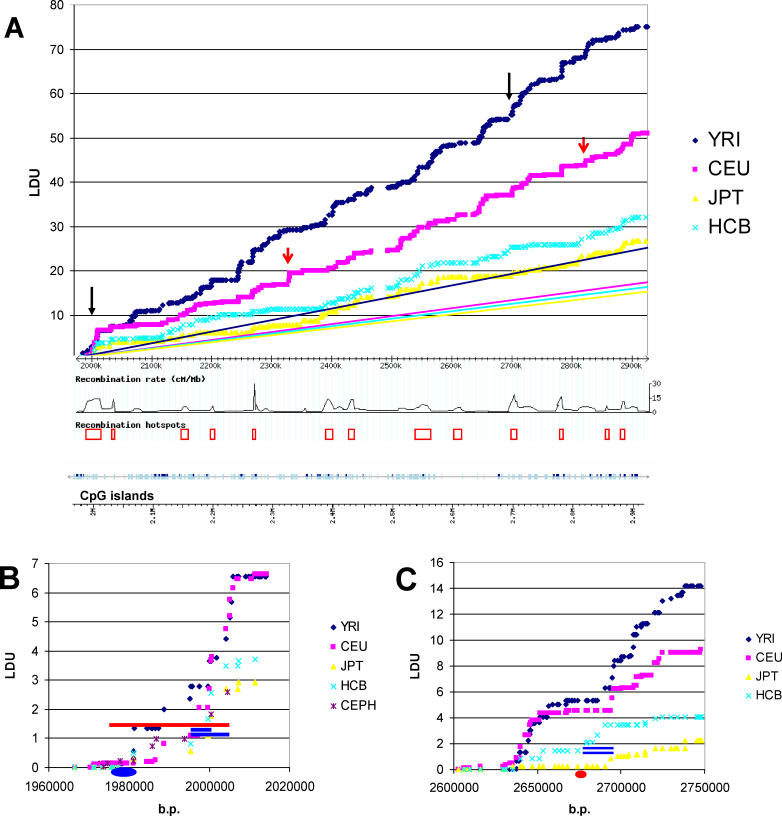
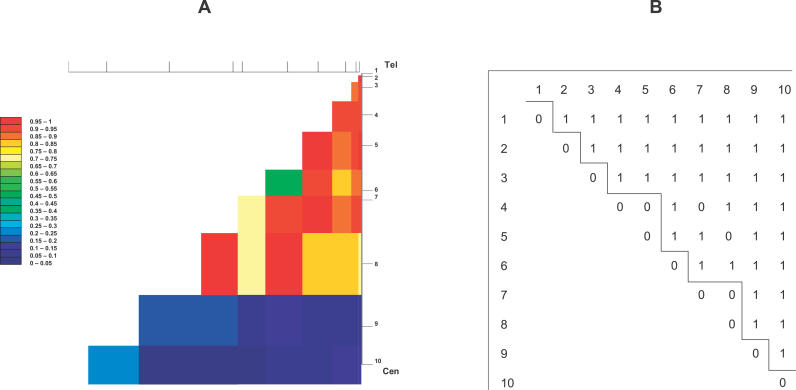
Human recombination rates vary along the chromosomes as well as between the two sexes. There is growing evidence that epigenetic factors may have an important influence on recombination rates, as well as on crossover position. Using both public database analysis and wet-bench approaches, we revisited the relationship between increased rates of meiotic recombination and genome imprinting. We constructed metric linkage disequilibrium (LD) maps for all human chromosomal regions known to contain one or more imprinted genes. We show that imprinted regions contain significantly more LD units (LDU) and have significantly more haplotype blocks of smaller sizes than flanking nonimprinted regions. There is also an excess of hot-spots of recombination at imprinted regions, and this is likely to do with the presence of imprinted genes, per se. These findings indicate that imprinted chromosomal regions are historical "hot-spots" of recombination. We also demonstrate, by direct segregation analysis at the 11p15.5 imprinted region, that there is remarkable agreement between sites of meiotic recombination and steps in LD maps. Although the increase in LDU/Megabase at imprinted regions is not associated with any significant enrichment for any particular sequence class, major sequence determinants of recombination rates seem to differ between imprinted and control regions. Interestingly, fine-mapping of recombination events within the most male meiosis-specific recombination hot-spot of Chromosome 11p15.5 indicates that many events may occur within or directly adjacent to regions that are differentially methylated in somatic cells. Taken together, these findings support the involvement of a combination of specific DNA sequences and epigenetic factors as major determinants of hot-spots of recombination at imprinted chromosomal regions.
Conflict of interest statement
Competing interests. The authors have declared that no competing interests exist.
Figures
Similar articles
-
Imprinted chromosomal regions of the human genome display sex-specific meiotic recombination frequencies.Curr Biol. 1995 Sep 1;5(9):1030-5. doi: 10.1016/s0960-9822(95)00207-7. Curr Biol. 1995. PMID: 8542279
-
HUMHOT: a database of human meiotic recombination hot spots.Nucleic Acids Res. 2006 Jan 1;34(Database issue):D25-8. doi: 10.1093/nar/gkj009. Nucleic Acids Res. 2006. PMID: 16381857 Free PMC article.
-
Human recombination hot spots hidden in regions of strong marker association.Nat Genet. 2005 Jun;37(6):601-6. doi: 10.1038/ng1565. Epub 2005 May 8. Nat Genet. 2005. PMID: 15880103
-
Molecular features of meiotic recombination hot spots.Bioessays. 2006 Jan;28(1):45-56. doi: 10.1002/bies.20349. Bioessays. 2006. PMID: 16369948 Review.
-
Epigenetic and genetic alterations of the imprinting disorder Beckwith-Wiedemann syndrome and related disorders.J Hum Genet. 2013 Jul;58(7):402-9. doi: 10.1038/jhg.2013.51. Epub 2013 May 30. J Hum Genet. 2013. PMID: 23719190 Review.
Cited by
-
The evolution of the DLK1-DIO3 imprinted domain in mammals.PLoS Biol. 2008 Jun 3;6(6):e135. doi: 10.1371/journal.pbio.0060135. PLoS Biol. 2008. PMID: 18532878 Free PMC article.
-
Sex-specific crossover distributions and variations in interference level along Arabidopsis thaliana chromosome 4.PLoS Genet. 2007 Jun;3(6):e106. doi: 10.1371/journal.pgen.0030106. Epub 2007 May 15. PLoS Genet. 2007. PMID: 17604455 Free PMC article.
-
The evolutionary turnover of recombination hot spots contributes to speciation in mice.Genes Dev. 2016 Feb 1;30(3):266-80. doi: 10.1101/gad.270009.115. Genes Dev. 2016. PMID: 26833728 Free PMC article.
-
Targeting shared pathways in tauopathies and age-related macular degeneration: implications for novel therapies.Front Aging Neurosci. 2024 Apr 3;16:1371745. doi: 10.3389/fnagi.2024.1371745. eCollection 2024. Front Aging Neurosci. 2024. PMID: 38633983 Free PMC article. Review.
-
Inflammation and DNA damage: cause, effect or both.Nat Rev Rheumatol. 2023 Apr;19(4):200-211. doi: 10.1038/s41584-022-00905-1. Epub 2023 Feb 7. Nat Rev Rheumatol. 2023. PMID: 36750681 Review.
References
-
- Petes TD. Meiotic recombination hot spots and cold spots. Nat Rev Genet. 2001;2:360–369. - PubMed
-
- Lynn A, Ashley T, Hassold T. Variation in human meiotic recombination. Annu Rev Genomics Hum Genet. 2004;5:317–349. - PubMed
-
- Pardo-Manuel de Villena F, de la Casa-Esperon E, Sapienza C. Natural selection and the function of genome imprinting: Beyond the silenced minority. Trends Genet. 2000;16:573–579. - PubMed
-
- Paldi A, Gyapay G, Jami J. Imprinted chromosomal regions of the human genome display sex-specific meiotic recombination frequencies. Curr Biol. 1995;5:1030–1035. - PubMed
Publication types
MeSH terms
Grants and funding
LinkOut - more resources
Full Text Sources
Research Materials
