Multivariate curve resolution of time course microarray data
- PMID: 16839419
- PMCID: PMC1539028
- DOI: 10.1186/1471-2105-7-343
Multivariate curve resolution of time course microarray data
Abstract
Background: Modeling of gene expression data from time course experiments often involves the use of linear models such as those obtained from principal component analysis (PCA), independent component analysis (ICA), or other methods. Such methods do not generally yield factors with a clear biological interpretation. Moreover, implicit assumptions about the measurement errors often limit the application of these methods to log-transformed data, destroying linear structure in the untransformed expression data.
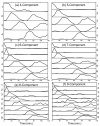
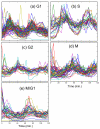
Results: In this work, a method for the linear decomposition of gene expression data by multivariate curve resolution (MCR) is introduced. The MCR method is based on an alternating least-squares (ALS) algorithm implemented with a weighted least squares approach. The new method, MCR-WALS, extracts a small number of basis functions from untransformed microarray data using only non-negativity constraints. Measurement error information can be incorporated into the modeling process and missing data can be imputed. The utility of the method is demonstrated through its application to yeast cell cycle data.
Conclusion: Profiles extracted by MCR-WALS exhibit a strong correlation with cell cycle-associated genes, but also suggest new insights into the regulation of those genes. The unique features of the MCR-WALS algorithm are its freedom from assumptions about the underlying linear model other than the non-negativity of gene expression, its ability to analyze non-log-transformed data, and its use of measurement error information to obtain a weighted model and accommodate missing measurements.
Figures


Similar articles
-
Exploratory data analysis of DNA microarrays by multivariate curve resolution.Anal Biochem. 2006 Nov 1;358(1):76-89. doi: 10.1016/j.ab.2006.07.028. Epub 2006 Aug 17. Anal Biochem. 2006. PMID: 16962983
-
A comparison of positive matrix factorization and the weighted multivariate curve resolution method. Application to environmental data.Environ Sci Technol. 2011 Dec 1;45(23):10102-10. doi: 10.1021/es201024m. Epub 2011 Nov 9. Environ Sci Technol. 2011. PMID: 22029401
-
Analysis of time course 1H NMR metabolomics data by multivariate curve resolution.Magn Reson Chem. 2009 Dec;47 Suppl 1:S105-17. doi: 10.1002/mrc.2535. Magn Reson Chem. 2009. PMID: 19899105
-
A classification-based framework for predicting and analyzing gene regulatory response.BMC Bioinformatics. 2006 Mar 20;7 Suppl 1(Suppl 1):S5. doi: 10.1186/1471-2105-7-S1-S5. BMC Bioinformatics. 2006. PMID: 16723008 Free PMC article.
-
A review of feature extraction software for microarray gene expression data.Biomed Res Int. 2014;2014:213656. doi: 10.1155/2014/213656. Epub 2014 Aug 31. Biomed Res Int. 2014. PMID: 25250315 Free PMC article. Review.
Cited by
-
Post hoc pattern matching: assigning significance to statistically defined expression patterns in single channel microarray data.BMC Bioinformatics. 2007 Jul 5;8:240. doi: 10.1186/1471-2105-8-240. BMC Bioinformatics. 2007. PMID: 17615071 Free PMC article.
-
Unsupervised machine learning for exploratory data analysis in imaging mass spectrometry.Mass Spectrom Rev. 2020 May;39(3):245-291. doi: 10.1002/mas.21602. Epub 2019 Oct 11. Mass Spectrom Rev. 2020. PMID: 31602691 Free PMC article. Review.
-
H-Profile plots for the discovery and exploration of patterns in gene expression data with an application to time course data.BMC Bioinformatics. 2007 Dec 20;8:486. doi: 10.1186/1471-2105-8-486. BMC Bioinformatics. 2007. PMID: 18096081 Free PMC article.
-
Assembly of Capsids from Hepatitis B Virus Core Protein Progresses through Highly Populated Intermediates in the Presence and Absence of RNA.ACS Nano. 2020 Aug 25;14(8):10226-10238. doi: 10.1021/acsnano.0c03569. Epub 2020 Aug 4. ACS Nano. 2020. PMID: 32672447 Free PMC article.
References
Publication types
MeSH terms
Substances
LinkOut - more resources
Full Text Sources
Other Literature Sources
Molecular Biology Databases
Miscellaneous

