. 2006 Aug;80(15):7699-705.
doi: 10.1128/JVI.00491-06.

Locus-specific gene expression pattern suggests a unique propagation strategy for a giant algal virus

Affiliations

Locus-specific gene expression pattern suggests a unique propagation strategy for a giant algal virus

Michael J Allen et al. J Virol. 2006 Aug.

Abstract

Emiliania huxleyi virus strain 86 is the largest algal virus sequenced to date and is unique among the Phycodnaviridae since its genome is predicted to contain six RNA polymerase subunit genes. We have used a virus microarray to profile the temporal transcription strategy of this unusual virus during infection. There are two distinct transcription phases to the infection process. The primary phase is dominated by a group of coding sequences (CDSs) expressed by 1 h postinfection that are localized to a subregion of the genome. The CDS of the primary group have no database homologues, and each is associated with a unique promoter element. The remainder of the CDSs are expressed in a secondary phase between 2 and 4 hours postinfection. Compartmentalized transcription of the two distinctive phases is discussed. We hypothesize that immediately after infection the nucleic acid of the virus targets the host nucleus, where primary-phase genes are transcribed by host RNA polymerase which recognizes the viral promoter. Secondary-phase transcription may then be conducted in the cytoplasm.


Figures
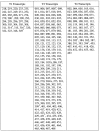
FIG. 1.
FIG. 1.
Grouping of EhV-86 CDSs. EhV-86 CDSs are listed at the experimental time point at which they first show statistically significant (P < 0.01) differential expression compared to that of baseline uninfected samples (T1, T2, and T4 indicate 1, 2, and 4 h postinfection, respectively). CDSs are included in this table only if they match two criteria. The first criterion requires CDSs to have signal intensity values above the detection threshold for at least two out of three print replicates (asterisks indicate two probe replicates in agreement). The detection threshold is defined nonparametrically as the ninetieth percentile of human negative-control probes. The second criterion requires the differential expression compared to that of uninfected samples to be statistically significant for all three print replicates of a CDS.
FIG. 2.
FIG. 2.
Scatterplots of absolute CDS expression for uninfected versus each of the infected samples. The center diagonal lines represent “no difference in expression,” and the two diagonal lines parallel to the center line represent the threshold for twofold-up and twofold-down regulation. The rectangular box outlined with a dashed line indicates the detection threshold for each of the two biological conditions; i.e., probes inside this box are not expressed or not measurable in uninfected and infected samples. The three replicate values for each CDS are shown.
FIG. 3.
FIG. 3.
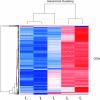
Biclustering of CDS and sample expression profiles in combination with heat map visualization. Each column represents the averaged log2 expression data for three independent samples for a biological condition. Each row in the heat map represents one CDS color coded for expression level from low (blue) to medium (white) to high (red). Branches on the top and side of the heat map show the identified clusters in the sample, i.e., samples with the most-similar expression profiles across all genes and genes with similar expression profiles across all samples. As expected, results for uninfected (Tu) samples and samples at 0 h postinfection (T0) are very closely related. The later time points T2 and T4 are also closely related. T1 is the most interesting, showing a cluster of CDSs which go from “off” in the Tu and T0 samples to “on.”
FIG. 4.
FIG. 4.
EhV-86 CDSs for which expression of the transcript could not be detected above threshold levels, confirmed, or tested. CDSs that have previously been detected in a 33-h postinfection lytic-phase transcriptional profile are in bold (22). A transcript is defined as “not detected” if at least two out of three print replicates for this gene have signal intensity values at or below the ninetieth percentile for the signal intensity value of human negative-control probes.

References

    1. Allen, M. J., D. C. Schroeder, A. Donkin, K. J. Crawfurd, and W. H. Wilson. 2006. Genome comparison of two coccolithoviruses. Virol. J. 3:15. - PMC - PubMed
    1. Allen, M. J., D. C. Schroeder, M. T. Holden, and W. H. Wilson. 2006. Evolutionary history of the coccolithoviridae. Mol. Biol. Evol. 23:86-92. - PubMed
    1. Allen, M. J., D. C. Schroeder, and W. H. Wilson. 2006. Preliminary characterisation of repeat families in the genome of EhV-86, a giant algal virus that infects the marine microalga Emiliania huxleyi. Arch. Virol. 151:525-535. - PubMed
    1. Amici, C., A. Rossi, A. Costanzo, S. Ciafre, B. Marinari, M. Balsamo, M. Levrero, and M. G. Santoro. 2006. Herpes simplex virus disrupts NF-κB regulation by blocking its recruitment on the IκBα promoter and directing the factor on viral genes. J. Biol. Chem. 281:7110-7117. - PubMed
    1. Chambers, J., A. Angulo, D. Amaratunga, H. Q. Guo, Y. Jiang, J. S. Wan, A. Bittner, K. Frueh, M. R. Jackson, P. A. Peterson, M. G. Erlander, and P. Ghazal. 1999. DNA microarrays of the complex human cytomegalovirus genome: profiling kinetic class with drug sensitivity of viral gene expression. J. Virol. 73:5757-5766. - PMC - PubMed

Publication types

MeSH terms