. 2006 Jul 13;34(12):e85.
doi: 10.1093/nar/gkl400.

Genomic DNA functions as a universal external standard in quantitative real-time PCR

Affiliations

Genomic DNA functions as a universal external standard in quantitative real-time PCR

James J Yun et al. Nucleic Acids Res. .

Erratum in

  • Nucleic Acids Res. 2006;34(22):6718

Abstract

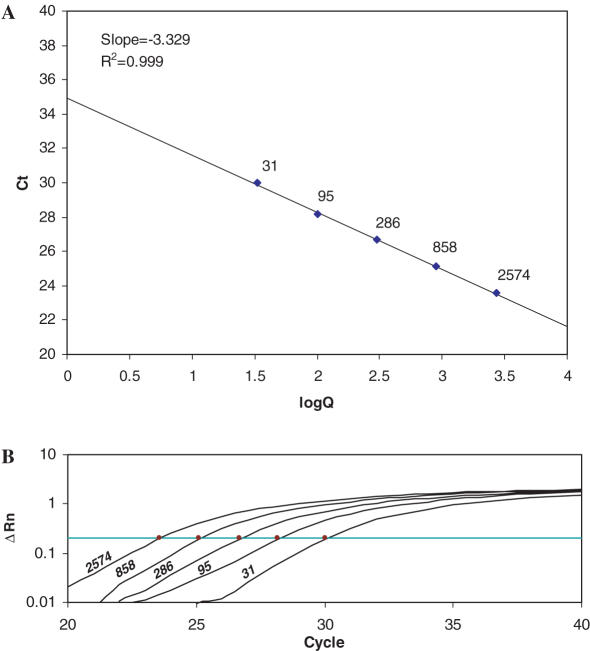
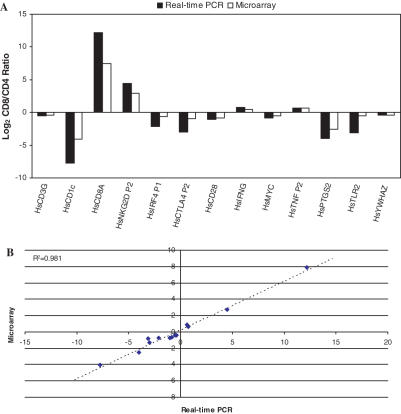
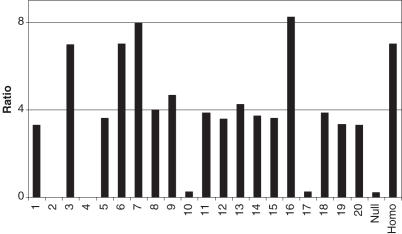
Real-time quantitative PCR (qPCR) is a powerful tool for quantifying specific DNA target sequences. Although determination of relative quantity is widely accepted as a reliable means of measuring differences between samples, there are advantages to being able to determine the absolute copy numbers of a given target. One approach to absolute quantification relies on construction of an accurate standard curve using appropriate external standards of known concentration. We have validated the use of tissue genomic DNA as a universal external standard to facilitate quantification of any target sequence contained in the genome of a given species, addressing several key technical issues regarding its use. This approach was applied to validate mRNA expression of gene candidates identified from microarray data and to determine gene copies in transgenic mice. A simple method that can assist achieving absolute quantification of gene expression would broadly enhance the uses of real-time qPCR and in particular, augment the evaluation of global gene expression studies.


Figures

Figure 1
Figure 1
(A) A typical standard curve of Ct versus log copy number. The points comprising the line are labeled with the copy number. (B) Ct values are obtained from amplification plots which indicate the change in normalized signal for the five standards (indicated with copy numbers) between cycles 20 and 40 of the PCR. Ct is the cycle at which fluorescence crosses a threshold value.
Figure 2
Figure 2
Verification of Amplicon Specificity using Restriction Enzymes (VASRE) on two real-time PCR amplicons. Expected digestion patterns are shown in the panels on the right. Dissociation curves after digestion with HpyCH4V and RsaI confirm the specificity of two amplicons when compared to expected results.
Figure 3
Figure 3
Effect of target position in assessment of PRKR copy number in gDNA and cDNA. (A) Target regions of five primers in PRKR transcript. (B) Absolute quantities in 9 ng of three gDNA (HT, human tonsil; HS, human subcarinal lymph node; HL, human lung) assessed using five primer pairs targeting different regions of the transcript. (C) Absolute quantities in 10 ng of cDNA from IFN treated or untreated U937 human monocytic cell line and 1 ng of cDNA from human peripheral CD4 and CD8 cells assessed using five primer pairs targeting different regions of the transcript. (D) Ratio of PRKR copy numbers between IFN treated and untreated U937 cells, and CD8+ and CD4+ T cells.
Figure 4
Figure 4
Assessment of gene transcript copy number using different real-time PCR targets. Expression level of eight genes was determined in CD4+ (open) and CD8+ (closed) T cells by amplification of two target sites in each gene. Absolute quantity was assessed in 1 ng of cDNA from each type of T cell. (A) The graph shows the quantity determined with each primer pair (P1 versus P2). (B) The correlation (0.968) between Log2 Ratio (CD8+/CD4+) for the two sets of primers is shown.
Figure 5
Figure 5
Validation of microarray data using real-time PCR with a gDNA standard. (A) Ratio of gene expression between CD4+ and CD8+ T cells as assessed by real-time PCR (closed) or Affymetrix Microarray (open). (B) Comparison of Log2 Ratios for each gene. The slope of the regression line (R2 = 0.981) is 0.59 indicating that microarray values are ∼60% of those seen by real-time PCR.
Figure 6
Figure 6
Genotyping of human-tau transgenic mice using mouse-tail gDNA as standard for real-time PCR. Null and homo indicate the expected ratio between absolute quantity of transgene and of internal reference gene in null (tau −/−) and homozygous (tau +/+) transgenic mice.

Similar articles

Cited by

References

    1. Rose'Meyer R.B., Mellick A.S., Garnham B.G., Harrison G.J., Massa H.M., Griffiths L.R. The measurement of adenosine and estrogen receptor expression in rat brains following ovariectomy using quantitative PCR analysis. Brain Res. Brain Res. Protoc. 2003;11:9–18. - PubMed
    1. Li X., Wang X. Application of real-time polymerase chain reaction for the quantitation of interleukin-1beta mRNA upregulation in brain ischemic tolerance. Brain Res. Brain Res. Protoc. 2000;5:211–217. - PubMed
    1. Tseng C.P., Cheng A.J., Chang J.T., Tseng C.H., Wang H.M., Liao C.T., Chen I.H., Tseng K.C. Quantitative analysis of multidrug-resistance mdr1 gene expression in head and neck cancer by real-time RT–PCR. Jpn. J. Cancer Res. 2002;93:1230–1236. - PMC - PubMed
    1. Yip S.P., Lee S.Y., To S.S., Wong M.L. Improved real-time PCR assay for homogeneous multiplex genotyping of four CYP2C9 alleles with hybridization probes. Clin. Chem. 2003;49:2109–2111. - PubMed
    1. Vandenbroucke II, Vandesompele J., Paepe A.D., Messiaen L. Quantification of splice variants using real-time PCR. Nucleic Acids Res. 2001;29:E68–E68. - PMC - PubMed

Publication types