

Bacterial regulatory networks are extremely flexible in evolution
- PMID: 16840530
- PMCID: PMC1524901
- DOI: 10.1093/nar/gkl423
Bacterial regulatory networks are extremely flexible in evolution
Erratum in
- Nucleic Acids Res. 2006;34(16):4653
Abstract
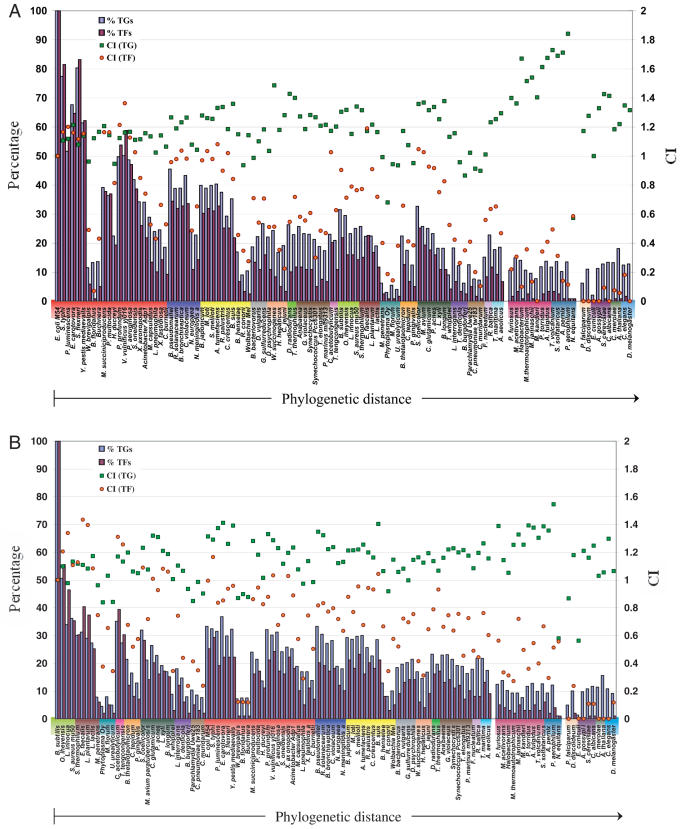
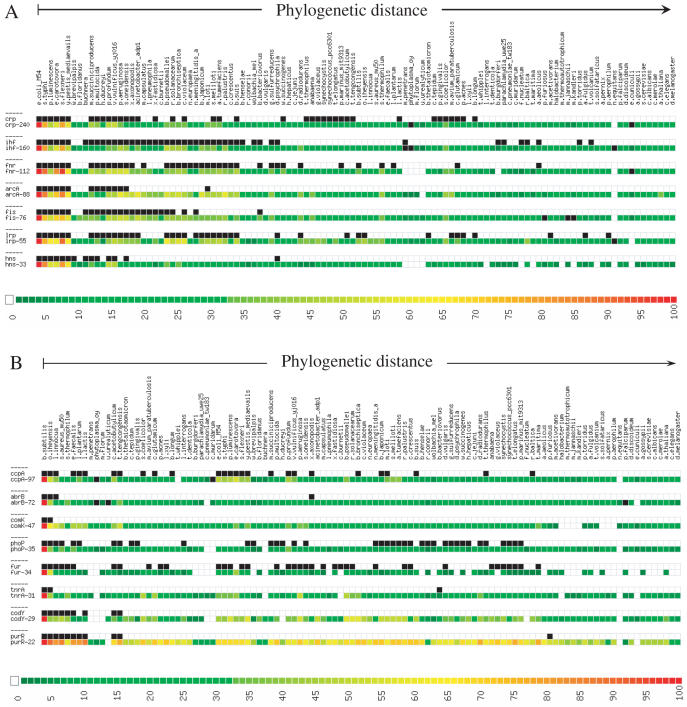
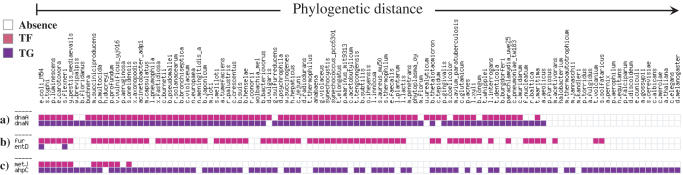
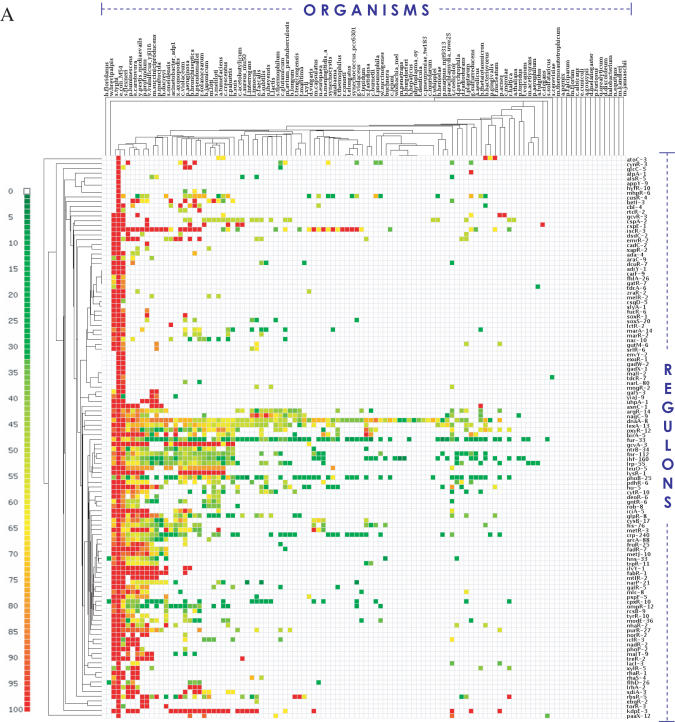
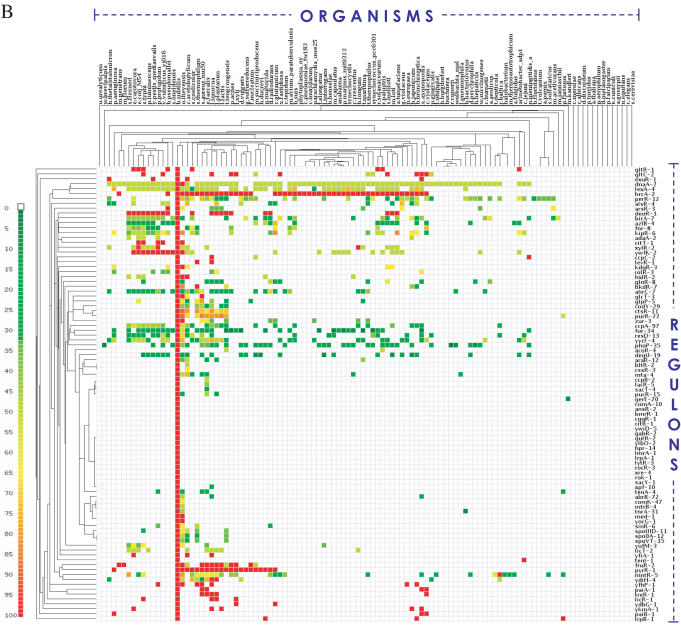
Over millions of years the structure and complexity of the transcriptional regulatory network (TRN) in bacteria has changed, reorganized and enabled them to adapt to almost every environmental niche on earth. In order to understand the plasticity of TRNs in bacteria, we studied the conservation of currently known TRNs of the two model organisms Escherichia coli K12 and Bacillus subtilis across complete genomes including Bacteria, Archaea and Eukarya at three different levels: individual components of the TRN, pairs of interactions and regulons. We found that transcription factors (TFs) evolve much faster than the target genes (TGs) across phyla. We show that global regulators are poorly conserved across the phylogenetic spectrum and hence TFs could be the major players responsible for the plasticity and evolvability of the TRNs. We also found that there is only a small fraction of significantly conserved transcriptional regulatory interactions among different phyla of bacteria and that there is no constraint on the elements of the interaction to co-evolve. Finally our results suggest that majority of the regulons in bacteria are rapidly lost implying a high-order flexibility in the TRNs. We hypothesize that during the divergence of bacteria certain essential cellular processes like the synthesis of arginine, biotine and ribose, transport of amino acids and iron, availability of phosphate, replication process and the SOS response are well conserved in evolution. From our comparative analysis, it is possible to infer that transcriptional regulation is more flexible than the genetic component of the organisms and its complexity and structure plays an important role in the phenotypic adaptation.
Figures
References
-
- Fell D.A., Wagner A. The small world of metabolism. Nat. Biotechnol. 2000;18:1121–1122. - PubMed
-
- Thieffry D., Huerta A.M., Perez-Rueda E., Collado-Vides J. From specific gene regulation to genomic networks: a global analysis of transcriptional regulation in Escherichia coli. Bioessays. 1998;20:433–440. - PubMed
-
- Shen-Orr S.S., Milo R., Mangan S., Alon U. Network motifs in the transcriptional regulation network of Escherichia coli. Nature Genet. 2002;31:64–68. - PubMed
-
- Martinez-Antonio A., Collado-Vides J. Identifying global regulators in transcriptional regulatory networks in bacteria. Curr. Opin. Microbiol. 2003;6:482–489. - PubMed
