Comparative Study
. 2006 Jul;83(7):499-511.
doi: 10.1097/01.opx.0000225091.60457.f4.

Evaluation of a two-stage neural model of glaucomatous defect: an approach to reduce test-retest variability

Affiliations
Comparative Study

Evaluation of a two-stage neural model of glaucomatous defect: an approach to reduce test-retest variability

Fei Pan et al. Optom Vis Sci. 2006 Jul.

Abstract

Purpose: The purpose of this study is to model perimetric defect and variability and identify stimulus conditions that can reduce variability while retaining good ability to detect glaucomatous defects.

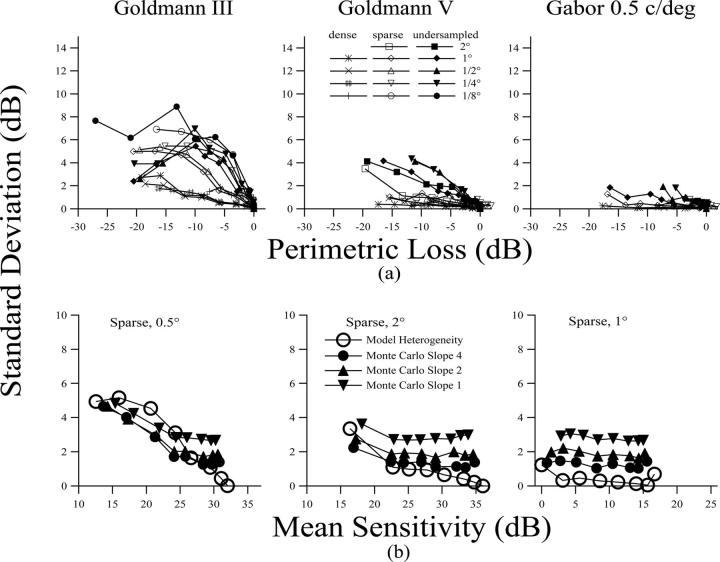
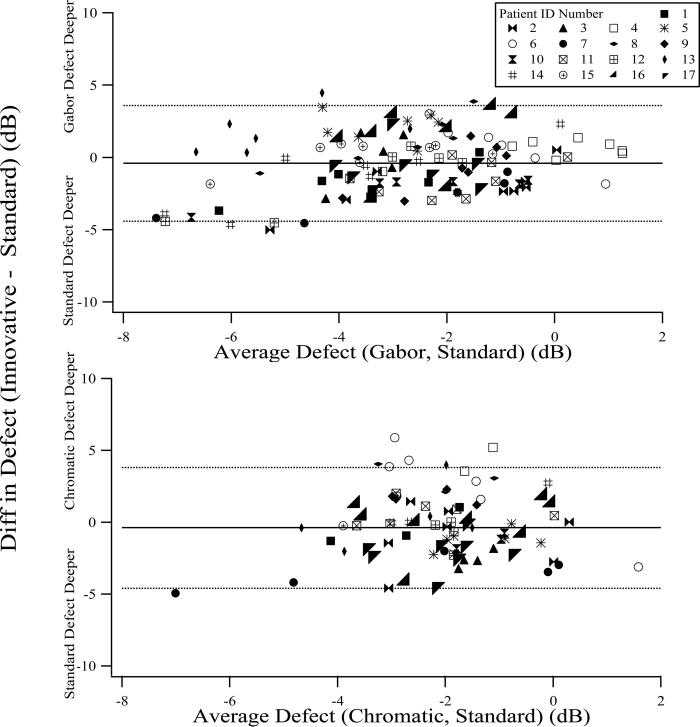
Methods: The two-stage neural model of Swanson et al. was extended to explore relations among perimetric defect, response variability, and heterogeneous glaucomatous ganglion cell damage. Predictions of the model were evaluated by testing patients with glaucoma using a standard luminance increment 0.43 degrees in diameter and two innovative stimuli designed to tap cortical mechanisms tuned to low spatial frequencies. The innovative stimuli were a luminance-modulated Gabor stimulus (0.5 c/deg) and circular equiluminant red-green chromatic stimuli whose sizes were close to normal Ricco's areas for the chromatic mechanism. Seventeen patients with glaucoma were each tested twice within a 2-week period. Sensitivities were measured at eight locations at eccentricities from 10 degrees to 21 degrees selected in terms of the retinal nerve fiber bundle patterns. Defect depth and response (test-retest) variability were compared for the innovative stimuli and the standard stimulus.

Results: The model predicted that response variability in defective areas would be lower for our innovative stimuli than for the conventional perimetric stimulus with similar defect depths if detection of the chromatic and Gabor stimuli was mediated by spatial mechanisms tuned to low spatial frequencies. Experimental data were consistent with these predictions. Depth of defect was similar for all three stimuli (F = 1.67, p > 0.19). Mean response variability was lower for the chromatic stimulus than for the other stimuli (F = 5.58, p < 0.005) and was lower for the Gabor stimulus than for the standard stimulus in areas with more severe defects (t = 2.68, p < 0.005). Variability increased with defect depth for the standard and Gabor stimuli (p < 0.005) but not for the chromatic stimulus (slope less than zero).

Conclusions: Use of large perimetric stimuli detected by cortical mechanisms tuned to low spatial frequencies can make it possible to lower response variability without comprising the ability to detect glaucomatous defect.


Figures

FIGURE 1
FIGURE 1
Depth of defect computed as a function of ganglion cell loss for all three stimuli with a range of ganglion cell populations (dense, sparse, and undersampled) and cortical populations (receptive field center width from 2° to 1/8°, shown in figure captions; they correspond to peak spatial frequencies from 0.25 to 4.0 c/deg). The thick line shows equality, when perimetric defect equals ganglion cell loss. Points falling above the line of equality represent conditions of cortical redundancy (cortical populations sampling small portions of the stimulus).
FIGURE 2
FIGURE 2
(a) Response variability as a function of mean defect for all three stimuli, with the ganglion cell and cortical cell parameters as in Figure. 1. Ganglion cell populations are characterized as dense, spare, and undersampled. Cortical populations cell populations are characterized by the width of the receptive field’s excitatory center (in degrees of visual angle). (b) Examples of effects of combined effects of heterogeneous damage and intrinsic noise. The open circles show heterogeneous damage for selected conditions replotted from the upper panels, and the solid symbols show results of Monte Carlo simulations of the full-threshold algorithm with increasing amounts of intrinsic noise (slopes from 4 to 1).
FIGURE 3
FIGURE 3
(a) Stimulus test locations indicated with the crosses. The ellipse represents the blind spot. (b) Standard stimulus. (c) Innovative stimuli.
FIGURE 4
FIGURE 4
The difference in depth of defect between the innovative stimuli and the standard stimulus is plotted against their mean. Data from different subjects are shown with different symbols. Horizontal lines show the mean and the upper and lower 95% confidence limits for the difference in depth of defect. Upper panel: Gabor; lower panel: chromatic.
FIGURE 5
FIGURE 5
(a) Mean depth of defect for the three stimuli is plotted both for the whole dataset (circles) and for a subset that contains one location randomly selected for each patient (squares). (b) Response variability, computed as the standard deviation of the difference in sensitivity between the two visits (asterisks) and computed on a point-by-point basis for the whole dataset (circles) and a subset (squares). Learning effect is shown with open triangles. Error bars show ± 1 standard error of mean.
FIGURE 6
FIGURE 6
(a) Percentage of abnormal locations identified by each stimulus. (b) Concordance between the innovative stimuli and the standard stimulus as for whether a test location was normal or abnormal. See text for details.
FIGURE 7
FIGURE 7
Individual test-retest variability is plotted against depth of defect. Data from different subjects are shown with different symbols. Horizontal lines show the mean and the upper 95% confidence limits of test-retest variability. Test-retest variability was significantly correlated with depth of defect for the standard and the Gabor stimuli but not for the chromatic stimulus. Regression lines not shown on figure (r2 <0.09).
FIGURE 8
FIGURE 8
Individual test-retest variability is plotted against depth of defect for data obtained from the first three reversals of the original staircase. Horizontal lines show the mean and the upper 95% confidence limits of test-retest variability. Test-retest variability was significantly correlated with depth of defect for the standard stimulus (regression line shown) but not for the Gabor or the chromatic stimuli.

References

    1. Swanson WH, Felius J, Pan F. Perimetric defects and ganglion cell damage: interpreting linear relations using a two-stage neural model. Invest Ophthalmol Vis Sci. 2004;45:466–72. - PubMed
    1. Thylefors B, Negrel AD. The global impact of glaucoma. Bull World Health Organ. 1994;72:323–6. - PMC - PubMed
    1. Quigley HA. Number of people with glaucoma worldwide. Br J Ophthalmol. 1996;80:389–93. - PMC - PubMed
    1. Coleman AL. Glaucoma. Lancet. 1999;354:1803–10. - PubMed
    1. Heijl A, Lindgren A, Lindgren G. Test-retest variability in glaucomatous visual fields. Am J Ophthalmol. 1989;108:130–5. - PubMed

Publication types