Comparative Study
. 2006 Oct;129(Pt 10):2667-78.
doi: 10.1093/brain/awl162. Epub 2006 Jul 14.

Network modulation in the treatment of Parkinson's disease

Affiliations
Comparative Study

Network modulation in the treatment of Parkinson's disease

Kotaro Asanuma et al. Brain. 2006 Oct.

Abstract

It has been proposed that deep brain stimulation (DBS) of the subthalamic nucleus (STN DBS) and dopaminergic therapy ameliorate the symptoms of Parkinson's disease through similar functional mechanisms. We examined this notion using PET to compare the metabolic effects of these treatment approaches. Nine Parkinson's disease patients (age 61.7 +/- 11.1 years) were scanned ON and OFF STN stimulation and nine others (age 60.0 +/- 9.3 years) were scanned ON and OFF an individual titrated intravenous levodopa infusion. The two treatment groups were matched for baseline disease severity as well as clinical response to therapy. Similarities and differences in the effects of treatment on regional metabolism were assessed using statistical parametric mapping (SPM). In addition, we used network analysis to assess the effect of therapy on the expression of an abnormal Parkinson's disease-related spatial covariance pattern (PDRP). We found that both STN DBS and levodopa therapy were associated with significant (P < 0.001) metabolic reductions in the putamen/globus pallidus, sensorimotor cortex and cerebellar vermis, as well as increases in the precuneus (BA 7). The metabolic effects of the two interventions differed in the STN and medial prefrontal cortex, with relative increases with stimulation in the former structure and decreases in the latter. Network quantification disclosed reductions in PDRP activity with both interventions, which correlated with clinical improvement (P < 0.05). The degree of network modulation by therapy did not differ significantly for the two treatment approaches (P > 0.6). These findings support the results of previous imaging studies indicating that effective symptomatic therapies for Parkinson's disease involve a common mechanism. The modulation of pathological brain networks is a critical feature of the treatment response in parkinsonism.


Figures
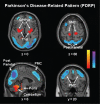
Fig. 1
Fig. 1
PDRP identified by spatial covariance analysis of FDG PET scans from 20 Parkinson's disease patients and 20 age-matched normal volunteer subjects (Asanuma et al., 2005). This pattern was characterized by relative metabolic increases in the pallidum and thalamus (upper left), in the pons and cerebellum (bottom left) and in sensorimotor cortex (SMC) (upper right). These changes covaried with metabolic decreases in the lateral premotor cortex (PMC) and in parieto-occipital association regions (bottom right). [The display represents voxels that contribute significantly to the network at P = 0.001, and that were demonstrated to be reliable (P < 0.001) on bootstrap estimation (Efron and Tibshirani, 1994). Voxels with positive region weights (metabolic increases) are colour coded from red to yellow; those with negative region weights (metabolic decreases) are colour coded from blue to purple.]
Fig. 2
Fig. 2
(Top) Regions in which the metabolic effects of treatment were similar for STN DBS and levodopa infusion (see text). Both interventions were associated with metabolic reductions in the cerebellar vermis, putamen/globus pallidus (Put/GP) and sensorimotor cortex (left and middle). Shared metabolic increases with treatment were identified in the precuneus (right). [SPM {t} maps were superimposed on a single-subject MRI brain template. Treatment-mediated metabolic decreases (blue–green scale) and increases (yellow–red scale) were thresholded at t = 2.6, P = 0.01 within the hypothesis-testing mask]. (Bottom) Bar graphs illustrating rates of glucose utilization for each of the significant clusters displayed above. Metabolic values (mean ± SE) are presented for each treatment condition. [OFF (filled bars) and ON (open bars) correspond to the treatment conditions for the stimulation (DBS) and levodopa (LD) groups. Regional changes with intervention appear in parentheses.]
Fig. 3
Fig. 3
(Top) Regions in which the metabolic effects of treatment were different for STN stimulation and levodopa infusion. Metabolic increases with stimulation relative to levodopa (left) were present in a cluster of voxels in the thalamus, extending into the subthalamic region. Relative metabolic decreases with stimulation (right) were present in the ventromedial prefrontal cortex. [SPM {t} maps were superimposed on a single-subject MRI brain template. Treatment-induced metabolic differences across interventions (blue–green scale) were thresholded at t = 2.6, P = 0.01 within the hypothesis-testing mask]. (Bottom) Bar graphs illustrating rates of glucose utilization for the significant clusters displayed above. Metabolic values (mean ± SE) are presented for each treatment condition. [OFF (filled bars) and ON (open bars) correspond to the treatment conditions for the stimulation (DBS) and levodopa (LD) groups. Regional changes with intervention appear in parentheses.]
Fig. 4
Fig. 4
Plot of mean values (±6SE) for the expression of the PDRP. Network scores were computed on an individual basis in the OFF and ON conditions for the STN stimulation (DBS) and the levodopa (LD) treatment groups, and in a test–retest control group (CN) (see text). Similar reductions in network expression were present with both interventions; the change in the control group was not significant. [Asterisks represent P-values with respect to baseline. *P < 0.05; **P < 0.01).]
Fig. 5
Fig. 5
Bar graph illustrating treatment-mediated changes (±SE) in the expression of the PDRP metabolic brain network. Left panel: Difference values from the levodopa infusion (LD; dotted), STN stimulation (DBS; black), and the test-retest control (CN; white) groups from the current study are presented. Changes in PDRP expression for two patients scanned while receiving both levodopa and STN stimulation are represented by a filled square and triangle (see text). In one of these subjects, the change in PDRP expression was also computed from a separate set of scans performed off and on levodopa infusion without STN DBS (open triangle). Right panel: These measures were compared with those computed on the basis of previous PET data (grey) from patient cohorts undergoing GPi and STN lesioning (Eidelberg et al., 1996; Su et al., 2001) and stimulation (Fukuda et al., 2001; Trošt et al., 2006). [The changes in PDRP expression were computed on a hemisphere-by-hemisphere basis for all treatment groups. For the unilateral surgical interventions, these values reflect changes in network activity in the operated hemispheres. For the bilateral therapies, including levodopa infusion, PDRP changes were computed for each hemisphere and averaged (Fukuda et al., 2001). [Asterisks represent p values with respect to the untreated condition (paired Student's t-test). *p<0.05, **p<0.01].

Similar articles

Cited by

References

    1. Asanuma K, Ma Y, Huang C, Carbon M, Edwards C, Raymond D, et al. The metabolic pathology of dopa-responsive dystonia. Ann Neurol. 2005;57:596–600. - PubMed
    1. Beck A. Beck depression inventory: manual. Psychological Corporation; San Antonio: 1987.
    1. Benabid AL. Deep brain stimulation for Parkinson's disease. Curr Opin Neurobiol. 2003;13:696–706. - PubMed
    1. Benazzouz A, Hallett M. Mechanism of action of deep brain stimulation. Neurology. 2000;55:S13–6. - PubMed
    1. Benton A, Hamsher K, Sivan A. Multilingual aphasia examination. 3rd edn. AJA Associates; Iowa City: 1994.

Publication types

MeSH terms