

Influence of hydration on the dynamics of lysozyme
- PMID: 16844746
- PMCID: PMC1562387
- DOI: 10.1529/biophysj.106.082214
Influence of hydration on the dynamics of lysozyme
Erratum in
- Biophys J. 2007 Jan 15;92(2):698
Abstract
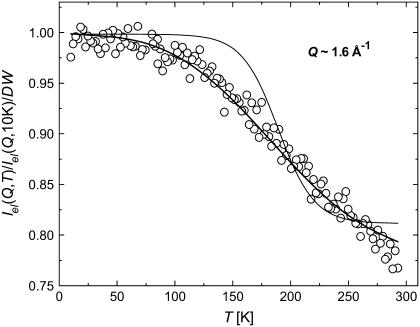
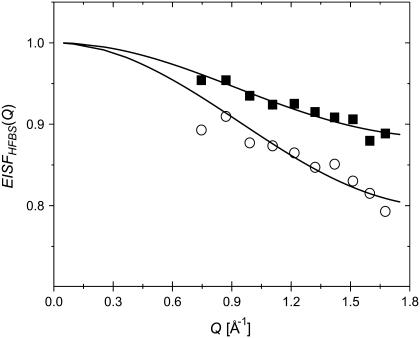
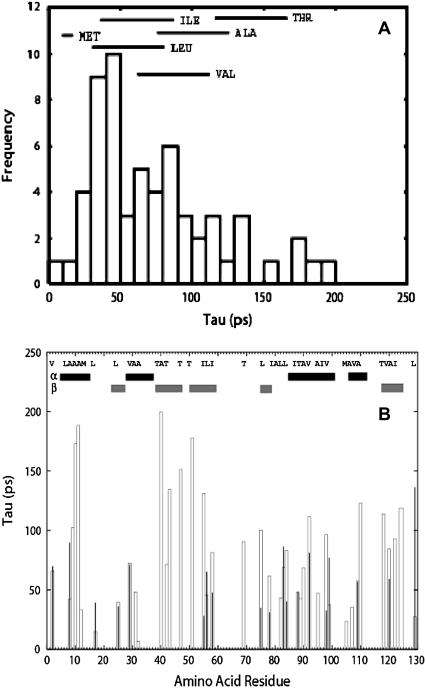
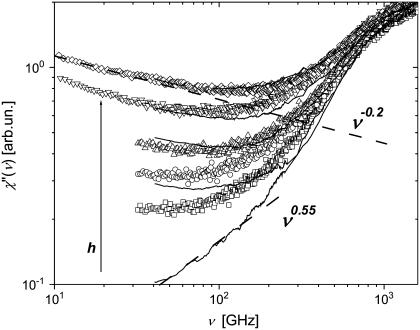
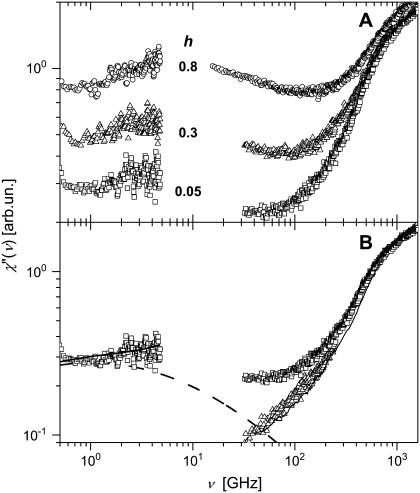
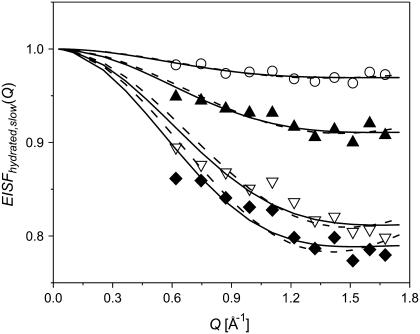
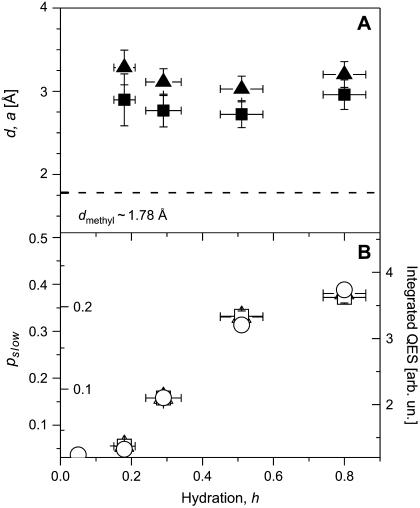
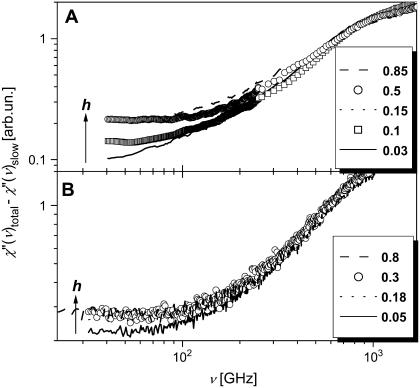
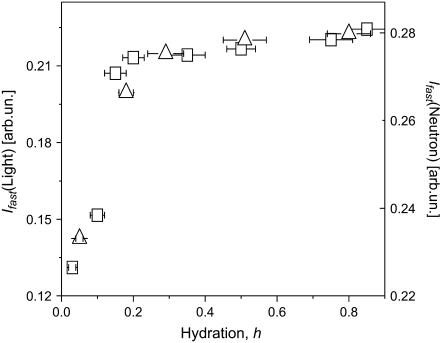
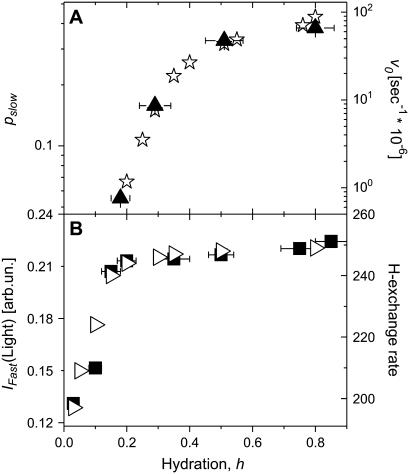
Quasielastic neutron and light-scattering techniques along with molecular dynamics simulations were employed to study the influence of hydration on the internal dynamics of lysozyme. We identified three major relaxation processes that contribute to the observed dynamics in the picosecond to nanosecond time range: 1), fluctuations of methyl groups; 2), fast picosecond relaxation; and 3), a slow relaxation process. A low-temperature onset of anharmonicity at T approximately 100 K is ascribed to methyl-group dynamics that is not sensitive to hydration level. The increase of hydration level seems to first increase the fast relaxation process and then activate the slow relaxation process at h approximately 0.2. The quasielastic scattering intensity associated with the slow process increases sharply with an increase of hydration to above h approximately 0.2. Activation of the slow process is responsible for the dynamical transition at T approximately 200 K. The dependence of the slow process on hydration correlates with the hydration dependence of the enzymatic activity of lysozyme, whereas the dependence of the fast process seems to correlate with the hydration dependence of hydrogen exchange of lysozyme.
Figures
Similar articles
-
Influence of pressure on the low-frequency vibrational modes of lysozyme and water: a complementary inelastic neutron scattering and molecular dynamics simulation study.Proteins. 2013 Feb;81(2):326-40. doi: 10.1002/prot.24189. Epub 2012 Nov 12. Proteins. 2013. PMID: 23011876
-
Molecular dynamics of solid-state lysozyme as affected by glycerol and water: a neutron scattering study.Biophys J. 2000 Nov;79(5):2728-32. doi: 10.1016/S0006-3495(00)76511-8. Biophys J. 2000. PMID: 11053145 Free PMC article.
-
Observation of high-temperature dynamic crossover in protein hydration water and its relation to reversible denaturation of lysozyme.J Chem Phys. 2009 Apr 7;130(13):135101. doi: 10.1063/1.3081137. J Chem Phys. 2009. PMID: 19355784
-
Dynamics of hydration water in proteins.Gen Physiol Biophys. 2009 Jun;28(2):168-73. doi: 10.4149/gpb_2009_02_168. Gen Physiol Biophys. 2009. PMID: 19592713 Review.
-
Protein dynamics investigated by neutron scattering.Photosynth Res. 2009 Nov-Dec;102(2-3):281-93. doi: 10.1007/s11120-009-9480-9. Epub 2009 Sep 11. Photosynth Res. 2009. PMID: 19763874 Review.
Cited by
-
The Dynamics of Hydrated Proteins Are the Same as Those of Highly Asymmetric Mixtures of Two Glass-Formers.ACS Omega. 2020 Dec 23;6(1):340-347. doi: 10.1021/acsomega.0c04655. eCollection 2021 Jan 12. ACS Omega. 2020. PMID: 33458485 Free PMC article.
-
Detecting the First Hydration Shell Structure around Biomolecules at Interfaces.ACS Cent Sci. 2022 Oct 26;8(10):1404-1414. doi: 10.1021/acscentsci.2c00702. Epub 2022 Sep 6. ACS Cent Sci. 2022. PMID: 36313165 Free PMC article.
-
Universal dynamical onset in water at distinct material interfaces.Chem Sci. 2022 Mar 28;13(15):4341-4351. doi: 10.1039/d1sc04650k. eCollection 2022 Apr 13. Chem Sci. 2022. PMID: 35509458 Free PMC article.
-
Coupling of protein and hydration-water dynamics in biological membranes.Proc Natl Acad Sci U S A. 2007 Nov 13;104(46):18049-54. doi: 10.1073/pnas.0706566104. Epub 2007 Nov 6. Proc Natl Acad Sci U S A. 2007. PMID: 17986611 Free PMC article.
-
Hydration dependence of active core fluctuations in bacteriorhodopsin.Biophys J. 2008 Jul;95(1):194-202. doi: 10.1529/biophysj.107.120386. Epub 2008 Mar 13. Biophys J. 2008. PMID: 18339747 Free PMC article.
References
-
- Daniel, R. M., R. V. Dunn, J. L. Finney, and J. C. Smith. 2003. The role of dynamics in enzyme activity. Annu. Rev. Biophys. Biomol. Struct. 32:69–92. - PubMed
-
- Gabel, F., D. Bicout, U. Lehnert, M. Tehei, M. Weik, and G. Zaccai. 2002. Protein dynamics studied by neutron scattering. Q. Rev. Biophys. 35:327–367. - PubMed
-
- Doster, W., and M. Settles. 1998. The dynamical transition in proteins: the role of hydrogen bonds. In Workshop on Hydration Processes in Biology: Theoretical and Experimental Approaches. M. C. Bellissent-Funel, editor. IOS Press, Les Houches, France. 177–191.
-
- Gregory, R. B., M. Gangoda, R. K. Gilpin, and W. Su. 1993. The influence of hydration on the conformation of lysozyme studied by solid-state 13C-NMR spectroscopy. Biopolymers. 33:513–519. - PubMed
-
- Rupley, J. A., and G. Careri. 1991. Protein hydration and function. Adv. Protein Chem. 41:37–172. - PubMed
Publication types
MeSH terms
Substances
LinkOut - more resources
Full Text Sources
