

Application of surface plasmon coupled emission to study of muscle
- PMID: 16844757
- PMCID: PMC1562373
- DOI: 10.1529/biophysj.106.088369
Application of surface plasmon coupled emission to study of muscle
Abstract
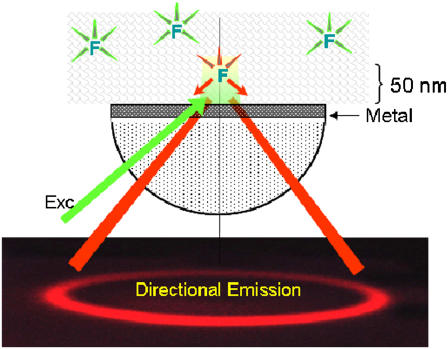
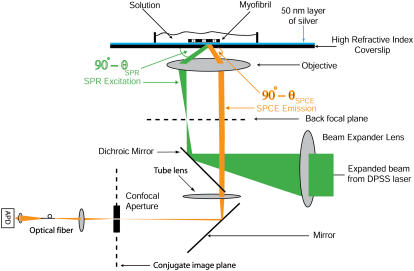
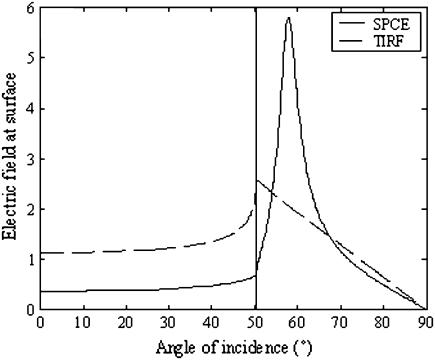
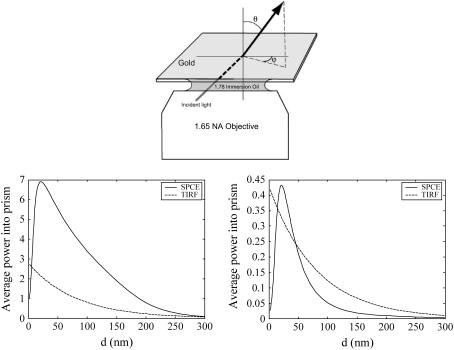
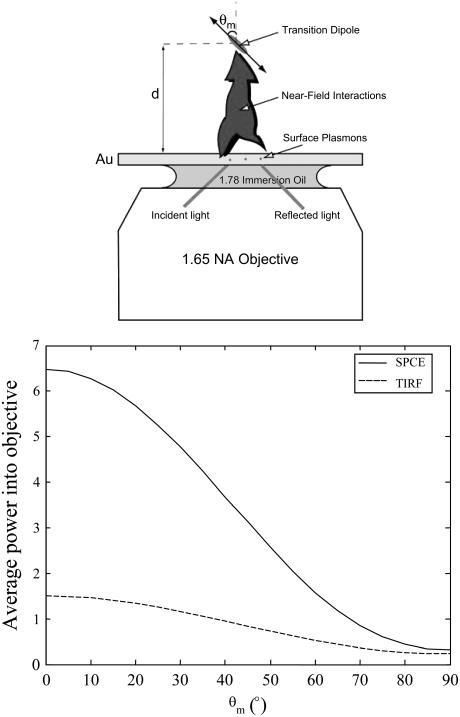
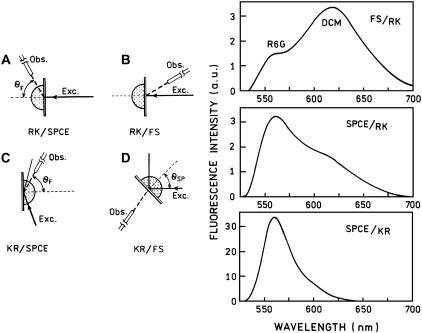
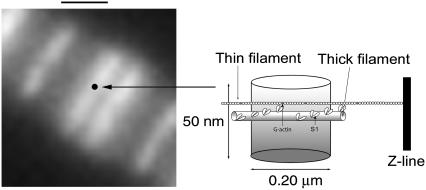
Muscle contraction results from interactions between actin and myosin cross-bridges. Dynamics of this interaction may be quite different in contracting muscle than in vitro because of the molecular crowding. In addition, each cross-bridge of contracting muscle is in a different stage of its mechanochemical cycle, and so temporal measurements are time averages. To avoid complications related to crowding and averaging, it is necessary to follow time behavior of a single cross-bridge in muscle. To be able to do so, it is necessary to collect data from an extremely small volume (an attoliter, 10(-18) liter). We report here on a novel microscopic application of surface plasmon-coupled emission (SPCE), which provides such a volume in a live sample. Muscle is fluorescently labeled and placed on a coverslip coated with a thin layer of noble metal. The laser beam is incident at a surface plasmon resonance (SPR) angle, at which it penetrates the metal layer and illuminates muscle by evanescent wave. The volume from which fluorescence emanates is a product of two near-field factors: the depth of evanescent wave excitation and a distance-dependent coupling of excited fluorophores to the surface plasmons. The fluorescence is quenched at the metal interface (up to approximately 10 nm), which further limits the thickness of the fluorescent volume to approximately 50 nm. The fluorescence is detected through a confocal aperture, which limits the lateral dimensions of the detection volume to approximately 200 nm. The resulting volume is approximately 2 x 10(-18) liter. The method is particularly sensitive to rotational motions because of the strong dependence of the plasmon coupling on the orientation of excited transition dipole. We show that by using a high-numerical-aperture objective (1.65) and high-refractive-index coverslips coated with gold, it is possible to follow rotational motion of 12 actin molecules in muscle with millisecond time resolution.
Figures
Similar articles
-
Minimization of detection volume by surface-plasmon-coupled emission.Anal Biochem. 2006 Sep 1;356(1):125-31. doi: 10.1016/j.ab.2006.05.007. Epub 2006 May 24. Anal Biochem. 2006. PMID: 16764813
-
Measuring rotations of a few cross-bridges in skeletal muscle.Exp Biol Med (Maywood). 2006 Jan;231(1):28-38. doi: 10.1177/153537020623100104. Exp Biol Med (Maywood). 2006. PMID: 16380642 Review.
-
Fluorescence correlation spectroscopy in surface plasmon coupled emission microscope.Opt Express. 2006 Aug 21;14(17):7878-88. doi: 10.1364/oe.14.007878. Opt Express. 2006. PMID: 19529155
-
Radiative decay engineering 3. Surface plasmon-coupled directional emission.Anal Biochem. 2004 Jan 15;324(2):153-69. doi: 10.1016/j.ab.2003.09.039. Anal Biochem. 2004. PMID: 14690679 Free PMC article.
-
Imaging transmitter release. II. A practical guide to evanescent-wave imaging.Lasers Med Sci. 2001;16(3):159-70. doi: 10.1007/pl00011350. Lasers Med Sci. 2001. PMID: 11482813 Review.
Cited by
-
Around-the-objective total internal reflection fluorescence microscopy.Appl Opt. 2009 Nov 10;48(32):6120-31. doi: 10.1364/AO.48.006120. Appl Opt. 2009. PMID: 19904308 Free PMC article.
-
Distinguishing between whole cells and cell debris using surface plasmon coupled emission.Biomed Opt Express. 2018 Mar 29;9(4):1977-1991. doi: 10.1364/BOE.9.001977. eCollection 2018 Apr 1. Biomed Opt Express. 2018. PMID: 29675333 Free PMC article.
-
Directing fluorescence with plasmonic and photonic structures.Acc Chem Res. 2015 Aug 18;48(8):2171-80. doi: 10.1021/acs.accounts.5b00100. Epub 2015 Jul 13. Acc Chem Res. 2015. PMID: 26168343 Free PMC article.
-
Wide-field extended-resolution fluorescence microscopy with standing surface-plasmon-resonance waves.Opt Lett. 2009 Aug 1;34(15):2366-8. doi: 10.1364/ol.34.002366. Opt Lett. 2009. PMID: 19649099 Free PMC article.
-
Surface-plasmon-coupled emission microscopy with a spiral phase plate.Opt Lett. 2010 Feb 15;35(4):517-9. doi: 10.1364/OL.35.000517. Opt Lett. 2010. PMID: 20160803 Free PMC article.
References
-
- Minton, A. P. 1998. Molecular crowding: analysis of effects of high concentrations of inert cosolutes on biochemical equilibria and rates in terms of volume exclusion. Methods Enzymol. 295:127–149. - PubMed
-
- Bagshaw, C. R. 1982. Muscle Contraction. Chapman & Hall, London.
-
- Arakawa, T., and S. N. Timasheff. 1985. Theory of protein solubility. Methods Enzymol. 114:49–77. - PubMed
Publication types
MeSH terms
Substances
Grants and funding
LinkOut - more resources
Full Text Sources
Other Literature Sources
