

A two-dimensional view of the folding energy landscape of cytochrome c
- PMID: 16844777
- PMCID: PMC1544053
- DOI: 10.1073/pnas.0604712103
A two-dimensional view of the folding energy landscape of cytochrome c
Abstract
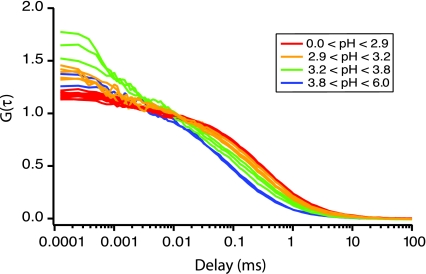
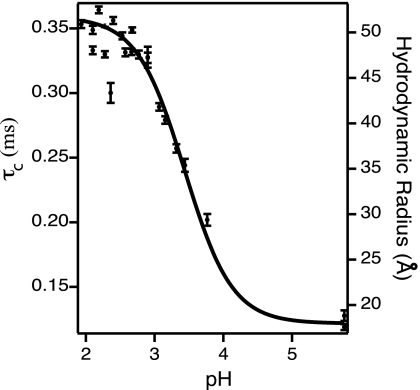
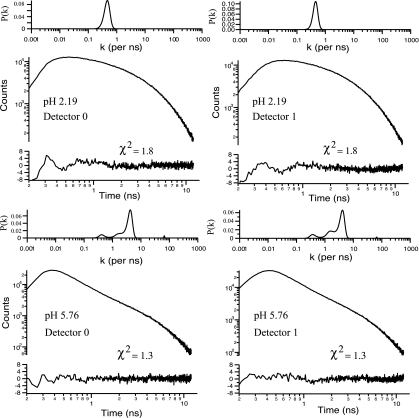
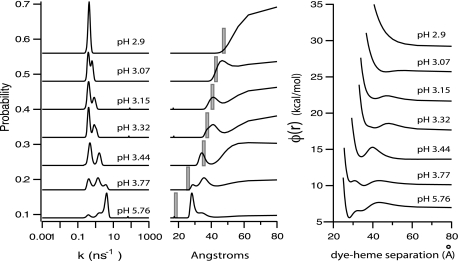
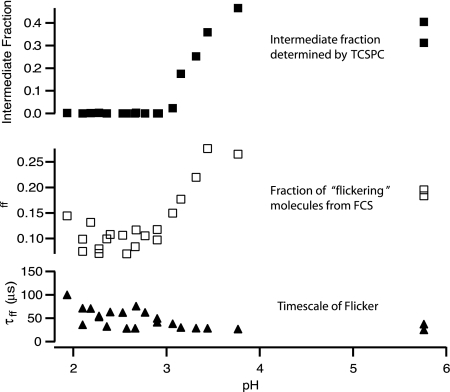
Time-correlated single photon counting (TCSPC) was combined with fluorescence correlation spectroscopy (FCS) to study the transition between acid-denatured states and the native structure of cytochrome c (Cyt c) from Saccharomyces cerevisiae. The use of these techniques in concert proved to be more powerful than either alone, yielding a two-dimensional picture of the folding energy landscape of Cyt c. TCSPC measured the distribution of distances between the heme of the protein and a covalently attached dye molecule at residue C102 (one folding reaction coordinate), whereas FCS measured the hydrodynamic radius (a second folding reaction coordinate) of the protein over a range of pH values. These two independent measurements provide complimentary information regarding protein conformation. We see evidence for a well defined folding intermediate in the acid renaturation folding pathway of this protein reflected in the distribution of lifetimes needed to fit the TCSPC data. Moreover, FCS studies revealed this intermediate state to be in dynamic equilibrium with unfolded structures, with conformational fluctuations into and out of this intermediate state occurring on an approximately 30-micros time scale.
Conflict of interest statement
Conflict of interest statement: No conflicts declared.
Figures
Similar articles
-
Folding of horse cytochrome c in the reduced state.J Mol Biol. 2001 Oct 5;312(5):1135-60. doi: 10.1006/jmbi.2001.4993. J Mol Biol. 2001. PMID: 11580255
-
Kinetics and motional dynamics of spin-labeled yeast iso-1-cytochrome c: 1. Stopped-flow electron paramagnetic resonance as a probe for protein folding/unfolding of the C-terminal helix spin-labeled at cysteine 102.Biochemistry. 1997 Mar 11;36(10):2884-97. doi: 10.1021/bi962155i. Biochemistry. 1997. PMID: 9062118
-
Coupled kinetic traps in cytochrome c folding: His-heme misligation and proline isomerization.J Mol Biol. 2000 May 19;298(5):955-69. doi: 10.1006/jmbi.2000.3700. J Mol Biol. 2000. PMID: 10801361
-
The folding energy landscape and free energy excitations of cytochrome c.Acc Chem Res. 2010 May 18;43(5):652-60. doi: 10.1021/ar9002703. Acc Chem Res. 2010. PMID: 20143816 Free PMC article. Review.
-
Enhancing the sensitivity of fluorescence correlation spectroscopy by using time-correlated single photon counting.Curr Pharm Biotechnol. 2005 Oct;6(5):405-14. doi: 10.2174/138920105774370625. Curr Pharm Biotechnol. 2005. PMID: 16248814 Review.
Cited by
-
Single-Molecule Analysis of Cytochrome c Folding by Monitoring the Lifetime of an Attached Fluorescent Probe.J Phys Chem Lett. 2013 Aug 15;4(16):2727-2733. doi: 10.1021/jz401259y. J Phys Chem Lett. 2013. PMID: 24116268 Free PMC article.
-
Origin of the conformational heterogeneity of cardiolipin-bound cytochrome C.J Am Chem Soc. 2012 Nov 14;134(45):18713-23. doi: 10.1021/ja307426k. Epub 2012 Nov 2. J Am Chem Soc. 2012. PMID: 23066867 Free PMC article.
-
Role of protein stabilizers on the conformation of the unfolded state of cytochrome c and its early folding kinetics: investigation at single molecular resolution.J Biol Chem. 2010 Aug 13;285(33):25314-23. doi: 10.1074/jbc.M110.116673. Epub 2010 Jun 10. J Biol Chem. 2010. PMID: 20538585 Free PMC article.
-
Two-Dimensional Fluorescence Lifetime Correlation Spectroscopy: Concepts and Applications.Molecules. 2018 Nov 14;23(11):2972. doi: 10.3390/molecules23112972. Molecules. 2018. PMID: 30441830 Free PMC article. Review.
-
Sub-millisecond time-resolved SAXS using a continuous-flow mixer and X-ray microbeam.J Synchrotron Radiat. 2013 Nov;20(Pt 6):820-5. doi: 10.1107/S0909049513021833. Epub 2013 Oct 1. J Synchrotron Radiat. 2013. PMID: 24121320 Free PMC article.
References
Publication types
MeSH terms
Substances
Grants and funding
LinkOut - more resources
Full Text Sources
Molecular Biology Databases
