. 2006 Aug;18(8):2005-20.
doi: 10.1105/tpc.106.043158. Epub 2006 Jul 14.

Tobacco Tsip1, a DnaJ-type Zn finger protein, is recruited to and potentiates Tsi1-mediated transcriptional activation

Affiliations

Tobacco Tsip1, a DnaJ-type Zn finger protein, is recruited to and potentiates Tsi1-mediated transcriptional activation

Byung-Kook Ham et al. Plant Cell. 2006 Aug.

Abstract

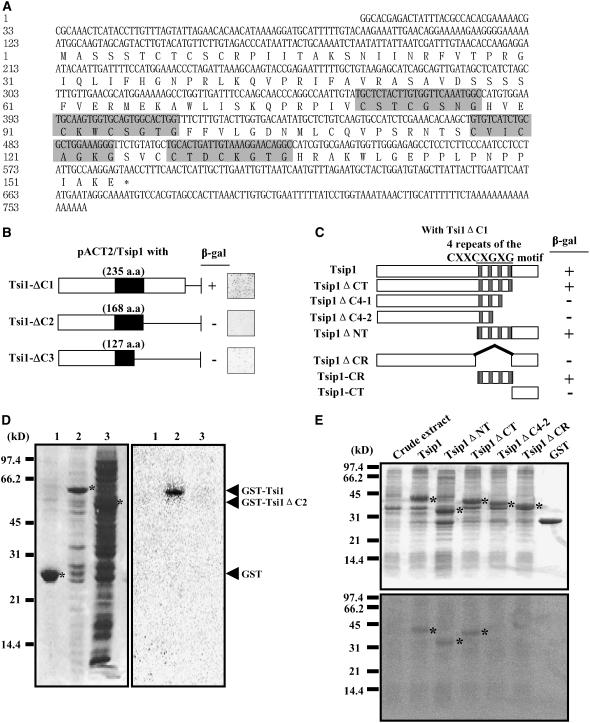
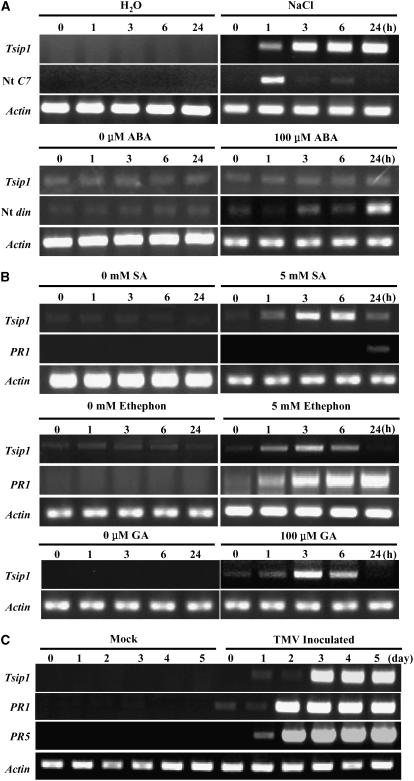
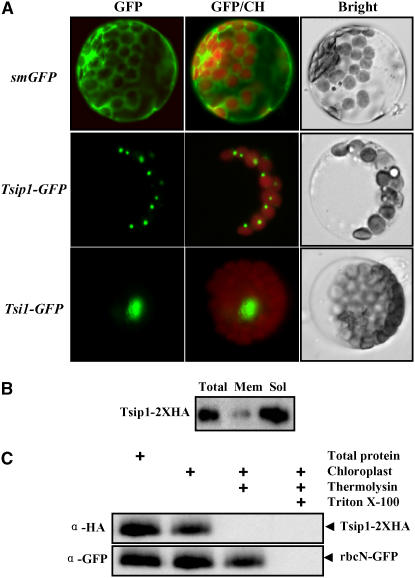
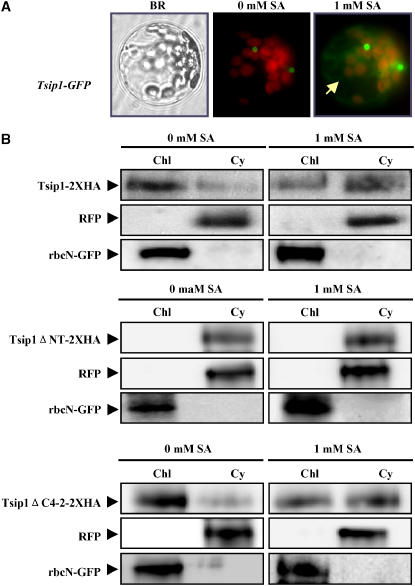
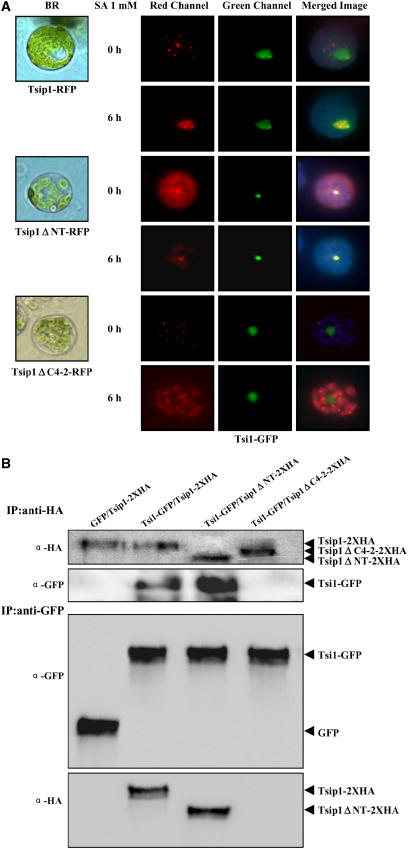
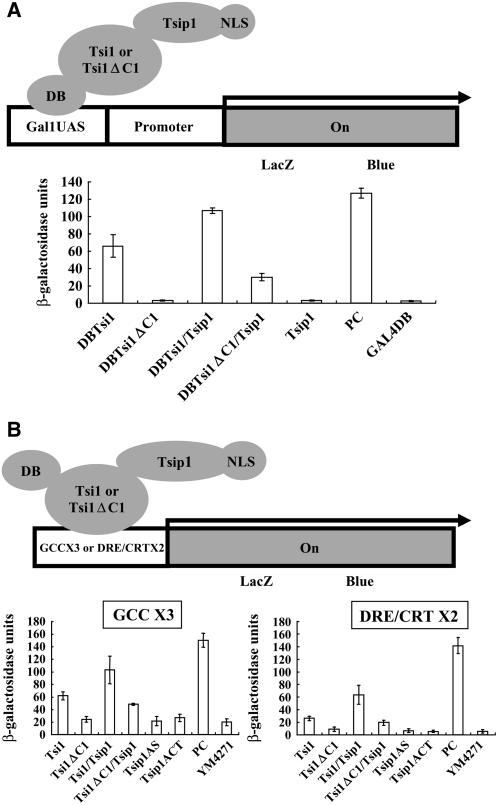
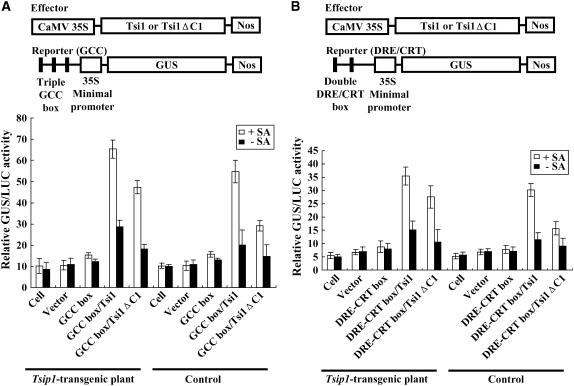
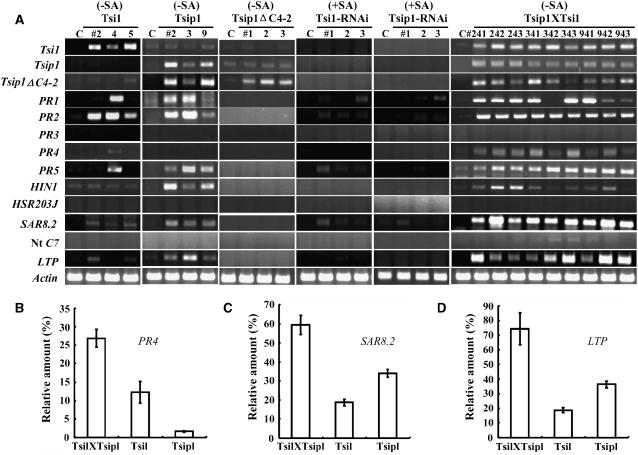
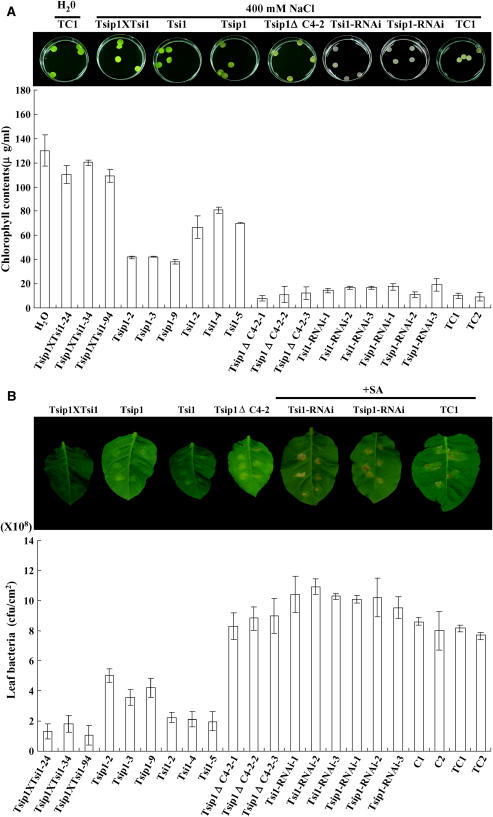
Tobacco stress-induced1 (Tsi1) is an ethylene-responsive-element binding protein/APETALA2-type transcription factor that plays an important role in both biotic and abiotic stress signaling pathways. We show that Tsi1-interacting protein1 (Tsip1), a DnaJ-type Zn finger protein, interacts with Tsi1 in vitro and in yeast (Saccharomyces cerevisiae). The transcript level of Tsip1 in tobacco (Nicotiana tabacum) increased upon treatment with salicylic acid (SA), ethylene, gibberellic acid, NaCl, and virus challenge. Tsip1 appeared to be physically associated with the chloroplast surface but dissociated from it after SA treatment. Tsip1 colocalized and coimmunoprecipitated with Tsi1 in plant cells following SA treatment. Tsip1 expression increased Tsi1-mediated transcription and was able to functionally compensate for loss of the Tsi1 transcriptional activation domain through a direct interaction with Tsi1. Transgenic plants simultaneously coexpressing Tsi1 and Tsip1 displayed stronger pathogen resistance and salt tolerance than did transgenic plants expressing either Tsi1 or Tsip1 alone. Concurrent with this, the expression of a subset of stress-related genes was induced in a cooperative manner in Tsi1/Tsip1 transgenic plants. These results together implied that Tsi1 recruits Tsip1 to the promoters of stress-related genes to potentiate Tsi1-mediated transcriptional activation.


Figures

Figure 1.
Figure 1.
Interaction of Tsip1 and Tsi1. (A) Nucleotide and predicted amino acid sequences of the tobacco Tsip1 cDNA clone. Gray boxes indicate the four Cys-rich (CXXCXGXG) repeats. (B) The C-terminal region of Tsi1 is important for interaction with Tsip1. Schematic representation of the Tsi1 deletion constructs used in the assay. The black box indicates the Tsi1 DNA binding domain. A colony-lift filter assay was performed to monitor protein–protein interactions between Tsip1 and the indicated Tsi1 deletion mutants (small squares to the right of the protein schematics). aa, amino acids. (C) The CXXCXGXG region of Tsip1 is necessary and sufficient for specific interaction with Tsi1. Schematic representation of the various Tsip1 deletion mutants tested. The shaded boxes represent the CXXCXGXG motifs. β-Gal activity was determined using the filter lift assay. +, interaction; –, no interaction. (D) Interaction of Tsi1 with Tsip1 in vitro. Left panel: GST, GST-Tsi1, and GST- Tsi1ΔC2 were expressed in Escherichia coli BL21 (DE) cells. Proteins were separated by SDS-PAGE and visualized by Coomassie blue staining. Asterisks indicate overexpressed GST, GST-Tsi1, or GST- Tsi1ΔC2. Right panel: far western gel overlay assay using in vitro–translated 35S-Met–labeled Tsip1 as a probe. Lane 1, purified GST; lane 2, the insoluble fraction of GST-Tsi1–expressing cells; lane 3, the insoluble fraction of GST-Tsi1ΔC2–expressing cells. (E) The CXXCXGXG motifs of Tsip1 are required for the binding of Tsip1 to Tsi1 in vitro. Top panel: 10 μg of the insoluble fractions of cells expressing GST-Tsip1 and the indicated GST-Tsip1 deletion mutants were separated by SDS-PAGE and stained with Coomassie blue. Asterisks indicate overexpressed GST-Tsip1 and the GST-Tsip1 deletion mutants. A far western gel overlay assay was performed using in vitro–translated 35S-Met–labeled Tsi1 (bottom panel) as a probe.
Figure 2.
Figure 2.
Tsip1 Gene Expression Patterns Determined by RT-PCR Analysis. (A) Induction of Tsip1 expression in tobacco plants by treatment with NaCl or ABA. To confirm the efficacy of treatment, primers specific for Nt din, which is induced in response to ABA, and Nt C7, which is induced in response to NaCl (Tamura et al., 2003), were also used. (B) Time course of Tsip1 expression following treatment with SA, ethephon, or GA. PR1 was used as a positive control for SA and ethephon treatment. (C) RT-PCR analysis of Tsip1, PR1, PR5, and Actin in TMV- and mock-inoculated tobacco leaves.
Figure 3.
Figure 3.
Subcellular Localization of Tsip1. (A) Tsip1-GFP expression in Arabidopsis protoplasts. Bright, bright-field image; GFP/CH, overlay of GFP (green) and chlorophyll (red) images; SmGFP, soluble modified GFP; Tsip1-GFP or Tsi1-GFP, Tsip1 or Tsi1 fused in frame to the 5′-end of GFP. (B) Protein gel blot analysis of Tsip1-2XHA. Total protein was isolated from transfected protoplasts and partitioned into membranous (Mem) and soluble (Sol) fractions. Thirty micrograms of each fraction was separated by SDS-PAGE, and protein gel blot analysis was performed using a polyclonal anti-HA antibody. (C) Tsip1 localizes to the surface of chloroplasts. Intact chloroplasts were isolated from protoplasts cotransfected with Tsip1-2XHA or rbcN-GFP. The protease thermolysin was added to the isolated chloroplasts in the presence or absence of Triton X-100, which functioned to dissolve the chloroplast membrane. Fifty micrograms of protein were resolved by SDS-PAGE and transferred to a nitrocellulose membrane. Membranes were then probed with antisera against HA and GFP. The arrowheads indicate the positions of Tsip1-2XHA and rbcN-GFP.
Figure 4.
Figure 4.
Effect of SA on the Localization of Tsip1. (A) Protoplasts transformed with Tsip1-GFP were incubated with 1 mM SA at room temperature and examined by fluorescence microscopy 1 to 3 h later. The arrow indicates the diffusion of Tsip1-GFP from chloroplasts to the cytoplasm. (B) Tsip1 relocalizes upon SA treatment. Cytosolic (Cy) and chloroplast (Chl) fractions of protoplasts were prepared by ultracentrifugation. RFP and rbcN-GFP were used as cytosolic and chloroplast markers, respectively. Fifty micrograms of protein were separated by SDS-PAGE, and protein gel blot analysis was performed using anti-HA, anti-RFP, or anti-GFP antibodies.
Figure 5.
Figure 5.
Tsi1 Colocalizes with Tsip1 and Tsip1ΔNT but Not with Tsip1ΔC4-2 in the Nuclei of Arabidopsis Protoplasts. (A) Subcellular localization of Tsip1-RFP, Tsip1ΔNT-RFP, or Tsip1ΔC4-2-RFP in protoplasts in the presence of cotransfected Tsi1-GFP. Overlay of green and red images results in orange/yellow signals in regions of coalignment of the fluorescent signals. (B) In vivo interaction of Tsip1 with Tsi1. Arabidopsis protoplasts were cotransfected with GFP and Tsip1-2XHA, Tsi1-GFP and Tsip1-2XHA, Tsi1-GFP and Tsip1ΔNT-2XHA, or Tsi1-GFP and Tsip1ΔC4-2-2XHA. After SA treatment for 6 h, immunoprecipitation was performed using anti-HA or anti-GFP antibodies from 1 mg of protoplast extract, followed by immunoblot analysis with the anti-HA (top) or anti-GFP (bottom) antibody.
Figure 6.
Figure 6.
Interaction of Tsip1 with Tsi1 Enhances the Transcriptional Activity of Tsi1 in Yeast. (A) Schematic representation of transcriptional activation mediated by GAL4 binding to the Gal1 upstream activation sequence Gal1UAS. Twenty independent colonies transfected with each of the indicated constructs were tested for β-gal activity. Data represent the means and se of assays on all 20 colonies. (B) Yeast transformants carrying lacZ reporter genes under the control of promoters containing a triple repeat of the GCC box or a double repeat of the DRE/CRT box were examined for β-gal activity in the presence of Tsip1 and Tsi1 or Tsi1ΔC1. A liquid culture assay using o-nitrophenyl-β-d-galactopyranoside as a substrate was performed to evaluate transcriptional activity in each of the transformants. The data represent the means and se of 20 independent colonies for each construct: Tsip1AS, Tsip1 cloned into pAS2-1; Tsip1ACT, Tsip1 cloned into pACT2 (Clontech); PC, positive control. PC represents the binding of p53 to three tandem repeats of the consensus p53 binding site. Transformants expressing GalDB or AD-Tsip1 did not display β-gal activity.
Figure 7.
Figure 7.
Tsip1 Enhances the Transcriptional Activity of Tsi1 in Planta. (A) Transactivation of the triple GCC-box-GUS reporter gene by Tsi1 in Arabidopsis protoplasts in the presence or absence of Tsip1. (B) Transactivation of the double DRE/CRT box-GUS reporter gene by Tsi1 in Arabidopsis protoplasts in the presence or absence of Tsip1. The effector and reporter constructs used in the cotransfection experiments are represented schematically in the top panels. Nos, the polyadenylation signal of the nopaline synthase gene. Effector, reporter, and 35S-LUC constructs were transfected into Arabidopsis protoplasts prepared from wild-type or Tsip1 transgenic plants. Experiments were performed in the presence (white squares) or the absence (black squares) of 1 mM SA. Ten micrograms of protein was used for the estimation of GUS and LUC activities. Data represent the means and se from five independent experiments. CaMV, Cauliflower mosaic virus.
Figure 8.
Figure 8.
Tsip1 Overexpression Increases the Expression of PR Genes, and Downregulation of Tsip1 Abolishes the Induction of PR Genes by SA Treatment. (A) Expression of pathogenesis-related genes in Tsip1 × Tsi1, Tsip1, Tsi1, Tsip1ΔC4-2, Tsi1-RNAi, and Tsip1-RNAi transgenic tobacco plants. Primer sets specific for the 3′ untranslated regions of Tsip1 or Tsi1 were used for detecting endogenously expressed Tsip1 or Tsi1 in Tsip1-RNAi or Tsi1-RNAi transgenic plants. PR gene expression was monitored in SA-treated Tsi1-RNAi and Tsip1-RNAi transgenic plants. The numbers indicate independent lines of transgenic T1 or F1 plants. The “C” indicates a pMBP2 vector-tranformed T1 plant. (B) to (D) Real-time quantitative RT-PCR analysis of PR4 (B), SAR8.2 (C), and LTP (D) expression in Tsip1 × Tsi1, Tsi1, and Tsip1 transgenic tobacco plants. Data were normalized to the level of Actin transcripts (set as 100%) and represent the means ± se of six independent experiments.
Figure 9.
Figure 9.
Transgenic Plants Simultaneously Expressing Tsip1 and Tsi1 Display Enhanced Salt Tolerance and Resistance to P. s. tabaci. (A) Analysis of the salt-induced senescence of Tsip1 × Tsi1, Tsip1, Tsip1ΔC4-2, Tsi1-RNAi, and Tsip1-RNAi transgenic plants. Leaf discs from transgenic plants carrying the Tsip1 gene in the sense orientation and pMBP2 vector-transformed transgenic plants (TC1 and TC2) were floated in 400 mM NaCl solution for 4 d under continuous white light at 25°C, and chlorophyll content (mg/g fresh weight) was measured. As a control, leaf discs of pMBP2 vector-transformed transgenic plants were floated in water. The photograph shows typical leaf discs (10-mm diameter) under each condition. The first bar of the graph represents the control leaf discs without NaCl treatment, and all others are values measured for leaf discs treated with 400 mM NaCl. Data represent the means and se of five independent experiments of four leaf discs each. (B) Analysis of resistance to the bacterial pathogen P. s. tabaci in wild-type (C1 and C2), pMBP2 vector-transformed transgenic plants (TC1 and TC2), and Tsip × Tsi1, Tsip1, Tsip1ΔC4-2, Tsi1-RNAi, and Tsip1-RNAi transgenic plants. Disease symptoms caused by P. s. tabaci are shown in the photographs taken 7 d after bacterial inoculation. Fully expanded leaves of 8-week-old tobacco plants were inoculated with 107 colony-forming units/mL of P. s. tabaci. Seven days later, discs (10-mm diameter) were cut from infected leaves and the bacterial titer determined. C1 and C2 or TC1 and TC2 indicate wild-type tobacco or pMBP2 vector-transformed transgenic plants, respectively. All transgenic plants used were independent tobacco T1 or F1 lines. Data represent the means and se of at least seven experiments using five plants per line and five discs from each plant.

Similar articles

Cited by

References

    1. Banecki, B., Liberek, K., Wall, D., Wawrzynow, A., Georgopoulos, C., Bertoli, E., Tanfani, F., and Zylicz, M. (1996). Structure-function analysis of the zinc finger region of the DnaJ molecular chaperone. J. Biol. Chem. 271 14840–14848. - PubMed
    1. Bauer, J., Chen, K., Hiltbunner, A., Wehrli, E., Eugster, M., Schnell, D., and Kessler, F. (2000). The major protein import receptor of plastids is essential for chloroplast biogenesis. Nature 403 203–207. - PubMed
    1. Braun, D.M., Stone, J.M., and Walker, J.C. (1997). Interaction of the maize and Arabidopsis kinase interaction domains with a subset of receptor-like protein kinases: Implications for transmembrane signals in plants. Plant J. 12 83–95. - PubMed
    1. Büttner, M., and Singh, K.B. (1997). Arabidopsis thaliana ethylene-responsive element binding protein (AtEBP), an ethylene-inducible, GCC box DNA-binding protein, interacts with an ocs element binding protein. Proc. Natl. Acad. Sci. USA 94 5961–5966. - PMC - PubMed
    1. Chen, W., et al. (2002). Expression profile matrix of Arabidopsis transcription factor genes suggests their putative functions in response to environmental stresses. Plant Cell 14 559–574. - PMC - PubMed

Publication types

MeSH terms

Associated data

LinkOut - more resources