

DILIMOT: discovery of linear motifs in proteins
- PMID: 16845024
- PMCID: PMC1538856
- DOI: 10.1093/nar/gkl159
DILIMOT: discovery of linear motifs in proteins
Abstract
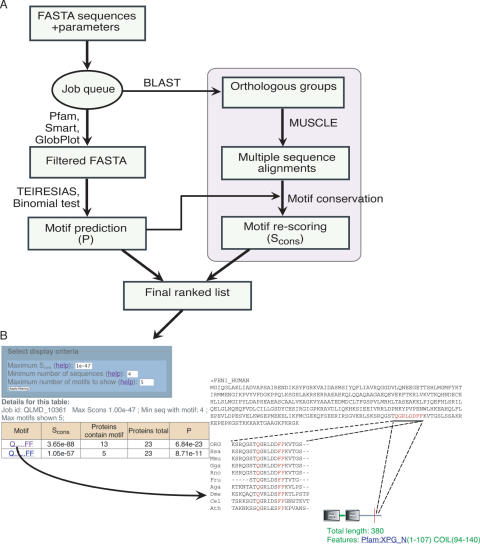
Discovery of protein functional motifs is critical in modern biology. Small segments of 3-10 residues play critical roles in protein interactions, post-translational modifications and trafficking. DILIMOT (DIscovery of LInear MOTifs) is a server for the prediction of these short linear motifs within a set of proteins. Given a set of sequences sharing a common functional feature (e.g. interaction partner or localization) the method finds statistically over-represented motifs likely to be responsible for it. The input sequences are first passed through a set of filters to remove regions unlikely to contain instances of linear motifs. Motifs are then found in the remaining sequence and ranked according to a statistic that measure over-representation and conservation across homologues in related species. The results are displayed via a visual interface for easy perusal. The server is available at http://dilimot.embl.de.
Figures
Similar articles
-
The SLiMDisc server: short, linear motif discovery in proteins.Nucleic Acids Res. 2007 Jul;35(Web Server issue):W455-9. doi: 10.1093/nar/gkm400. Epub 2007 Jun 18. Nucleic Acids Res. 2007. PMID: 17576682 Free PMC article.
-
AutoMotif server: prediction of single residue post-translational modifications in proteins.Bioinformatics. 2005 May 15;21(10):2525-7. doi: 10.1093/bioinformatics/bti333. Epub 2005 Feb 22. Bioinformatics. 2005. PMID: 15728119
-
iMOT: an interactive package for the selection of spatially interacting motifs.Nucleic Acids Res. 2004 Jul 1;32(Web Server issue):W602-5. doi: 10.1093/nar/gkh375. Nucleic Acids Res. 2004. PMID: 15215459 Free PMC article.
-
Discovering sequence motifs.Methods Mol Biol. 2008;452:231-51. doi: 10.1007/978-1-60327-159-2_12. Methods Mol Biol. 2008. PMID: 18566768 Review.
-
Computational prediction of short linear motifs from protein sequences.Methods Mol Biol. 2015;1268:89-141. doi: 10.1007/978-1-4939-2285-7_6. Methods Mol Biol. 2015. PMID: 25555723 Review.
Cited by
-
+TIPs: SxIPping along microtubule ends.Trends Cell Biol. 2012 Aug;22(8):418-28. doi: 10.1016/j.tcb.2012.05.005. Epub 2012 Jun 28. Trends Cell Biol. 2012. PMID: 22748381 Free PMC article. Review.
-
The SLiMDisc server: short, linear motif discovery in proteins.Nucleic Acids Res. 2007 Jul;35(Web Server issue):W455-9. doi: 10.1093/nar/gkm400. Epub 2007 Jun 18. Nucleic Acids Res. 2007. PMID: 17576682 Free PMC article.
-
Finding motif pairs in the interactions between heterogeneous proteins via bootstrapping and boosting.BMC Bioinformatics. 2009 Jan 30;10 Suppl 1(Suppl 1):S57. doi: 10.1186/1471-2105-10-S1-S57. BMC Bioinformatics. 2009. PMID: 19208160 Free PMC article.
-
Sequence- and interactome-based prediction of viral protein hotspots targeting host proteins: a case study for HIV Nef.PLoS One. 2011;6(6):e20735. doi: 10.1371/journal.pone.0020735. Epub 2011 Jun 28. PLoS One. 2011. PMID: 21738584 Free PMC article.
-
Experimental detection of short regulatory motifs in eukaryotic proteins: tips for good practice as well as for bad.Cell Commun Signal. 2015 Nov 18;13:42. doi: 10.1186/s12964-015-0121-y. Cell Commun Signal. 2015. PMID: 26581338 Free PMC article. Review.
References
Publication types
MeSH terms
Substances
LinkOut - more resources
Full Text Sources
Other Literature Sources
