

QGRS Mapper: a web-based server for predicting G-quadruplexes in nucleotide sequences
- PMID: 16845096
- PMCID: PMC1538864
- DOI: 10.1093/nar/gkl253
QGRS Mapper: a web-based server for predicting G-quadruplexes in nucleotide sequences
Abstract
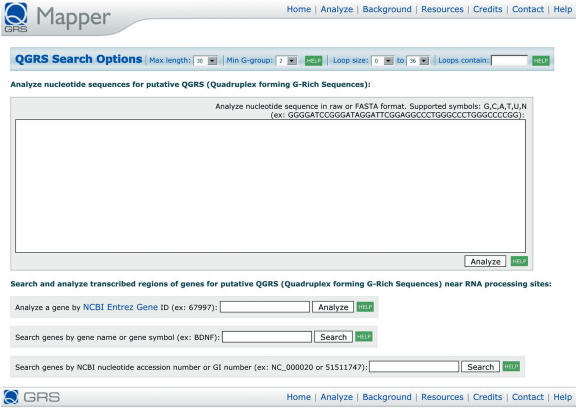
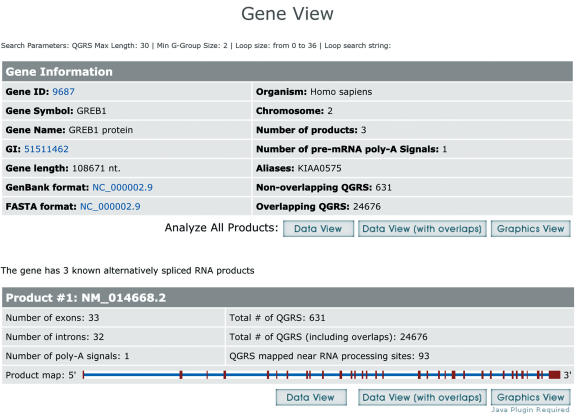
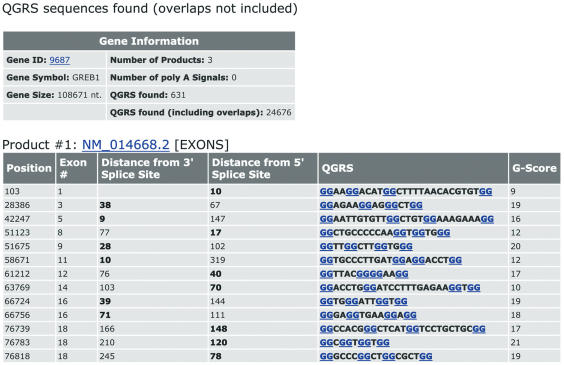
The quadruplex structures formed by guanine-rich nucleic acid sequences have received significant attention recently because of growing evidence for their role in important biological processes and as therapeutic targets. G-quadruplex DNA has been suggested to regulate DNA replication and may control cellular proliferation. Sequences capable of forming G-quadruplexes in the RNA have been shown to play significant roles in regulation of polyadenylation and splicing events in mammalian transcripts. Whether quadruplex structure directly plays a role in regulating RNA processing requires investigation. Computational approaches to study G-quadruplexes allow detailed analysis of mammalian genomes. There are no known easily accessible user-friendly tools that can compute G-quadruplexes in the nucleotide sequences. We have developed a web-based server, QGRS Mapper, that predicts quadruplex forming G-rich sequences (QGRS) in nucleotide sequences. It is a user-friendly application that provides many options for defining and studying G-quadruplexes. It performs analysis of the user provided genomic sequences, e.g. promoter and telomeric regions, as well as RNA sequences. It is also useful for predicting G-quadruplex structures in oligonucleotides. The program provides options to search and retrieve desired gene/nucleotide sequence entries from NCBI databases for mapping G-quadruplexes in the context of RNA processing sites. This feature is very useful for investigating the functional relevance of G-quadruplex structure, in particular its role in regulating the gene expression by alternative processing. In addition to providing data on composition and locations of QGRS relative to the processing sites in the pre-mRNA sequence, QGRS Mapper features interactive graphic representation of the data. The user can also use the graphics module to visualize QGRS distribution patterns among all the alternative RNA products of a gene simultaneously on a single screen. QGRS Mapper can be accessed at http://bioinformatics.ramapo.edu/QGRS/.
Figures

References
-
- Simonsson T. G-quadruplex DNA structures—variations on a theme. Biol. Chem. 2001;382:621–628. - PubMed
-
- Davis J.T. G-quartets 40 years later: from 5′-GMP to molecular biology and supramolecular chemistry. Angew Chem. Int. Ed. Engl. 2004;43:668–698. - PubMed
-
- Sharma S., Doherty K.M., Brosh R.M., ,Jr DNA helicases as targets for anti-cancer drugs. Curr. Med. Chem. Anticancer Agents. 2005;5:183–199. - PubMed
-
- Kelland L.R. Overcoming the immortality of tumour cells by telomere and telomerase based cancer therapeutics—current status and future prospects. Eur. J. Cancer. 2005;41:971–979. - PubMed
Publication types
MeSH terms
Substances
LinkOut - more resources
Full Text Sources
Other Literature Sources
