

doi: 10.1038/sj.embor.7400751.
Epub 2006 Jul 14.
Temporal and spatial delineation of mouse Otx2 functions by conditional self-knockout
Affiliations
- PMID: 16845372
- PMCID: PMC1525150
- DOI: 10.1038/sj.embor.7400751
Item in Clipboard
Temporal and spatial delineation of mouse Otx2 functions by conditional self-knockout
EMBO Rep.
2006 Aug.
Abstract
To identify the independent spatial and temporal activities of the essential developmental gene the Otx2, the germline mutation of which is lethal at embryonic day 8.5, we floxed one allele and substituted the other with an inducible CreER recombinase gene. This makes 'trans' self-knockout possible at any developmental stage. The transient action of tamoxifen pulses allows time-course mutation. We demonstrate efficient temporal knockout and demarcate spatio-temporal windows in which Otx2 controls the head, brain structures and body development.
Figures

The knock-in-based CreERT2 strategy. (A) The mating of an Otx2flox/CreERT2 male with a homozygous Otx2flox/flox female yields 50% Otx2flox/CreERT2 and 50% Otx2flox/flox embryos. Intraperitoneal tamoxifen injection (Tam i.p., blue) triggers gene deletion only in Otx2flox/CreERT2 embryos and solely in cells expressing Otx2. Purple and yellow boxes correspond to Otx2 and CreERT2 genes, respectively, and red triangles to loxP sites. (B) Potentialities of the method. During normal development (top), two spatially and temporally distinct Otx2 expression sites (purple circles 1 and 2) control the development of structures S1 and S2. Depending on when CreERT2 is activated (+tam, yellow stripes), the Otx2 gene is deleted in region 1 (middle) or 2 (bottom), perturbing development of structure S1 or S2, respectively. (C) In situ hybridization of Otx2+/CreERT2 embryos at embryonic day (E)6.5–E10.5 (whole mount) and E16.5 (sagittal sections) and adults (transversal sections) at the level of mesencephalon (top) and cerebellum (bottom) with CreERT2 and Otx2 probes (insets; for probes used, see supplementary Figs S1,S2 online). The arrow points to the isthmus. Scale bars, 100 μm for E6.5–E8.5, 500 μm for E10.5, E.16.5 and adult. cb, cerebellum; cp, choroid plexus; di, diencephalon; mes, mesencephalon; oe, olfactory epithelium; op, otic placode; ov, optic vesicle; sc, superior colliculi; tel, telencephalon.

Efficient Otx2 deletion after single tamoxifen injection. (A) Morphology of animals of indicated age and genotype after tamoxifen (Tam) or solvent (Mock) injection at embryonic day (E)7.5. Scale bars, 500 μm. (B) PCR detection of flox and deleted exon 2 (Δe2) alleles (for primers, see supplementary Fig S1 online) using DNA from the brain or head of embryos of indicated age and genotype. (C) Alkaline phosphatase activity in E9.5 Otx2+/CreERT2 ; Z/AP embryos that received tamoxifen or solvent at E7.5. Scale bar, 500 μm. (D) PCR analysis, as in (B), using DNA from the indicated part, and age of Otx2flox/CreERT2 embryos after tamoxifen (Tam) or solvent (mock) injection at the indicated stages. (E–L) In situ hybridization with Otx2 exon 2 probe and CreERT2 probe (insets; for probes, see supplementary Figs S1,S2 online) of sagittal sections of Otx2flox/CreERT2 embryos that received tamoxifen (Tam) or solvent (Mock) at indicated times and were collected 30 h later. Scale bars, 1 mm.

Biological consequences of Otx2 invalidation at embryonic day (E)10.5, E12.5, E14.5 or E16.5. (A) Genotype distribution, at E18.5 and P10, of F1 animals (Fig 1A) that received tamoxifen (Tam) at the indicated time or solvent (Mock). The number of individuals analysed is indicated at the top of the bars. (B) Morphology of E14.5 and P0 Otx2flox/CreERT2 mice after tamoxifen injection at E10.5. Scale bars, 2 mm. (C) Size comparison of 10-week littermates of the indicated genotypes that received tamoxifen at E12.5. (D) Weight distribution of animals of the indicated genotypes at P10, 3 weeks and 10 weeks after birth versus time of tamoxifen (Tam) or solvent (Mock) injection. Histograms represent mean value and error bars are standard deviation. The number of animals in each series is shown at the bottom. *P<0.001 after Student's t-test. (E–L) Anatomical and histological comparison of midbrain/hindbrain development at P10. Dorsal view of the brain (E–H) and Nissl-stained sagittal sections (I–L) of animals that received tamoxifen at E12.5 (E,I), E14.5 (F,J), E16.5 (G,K) or solvent (H,L). Arrows point to the inferior colliculi. The arrowhead points to the granular-like staining of the mesencephalon. Asterisk shows size and foliation defects of posterior cerebellum. ic, inferior colliculus; sc, superior colliculus. (M–P) Alkaline phosphatase activity in sagittal sections of brains of P10 Otx2+/CreERT2 ; Z/AP animals that received tamoxifen at time corresponding to the panels above. Scale bars, 2 mm. (Q–T) Histological organization of ectopic cerebellar-like structure (Ecto) and endogenous cerebellum (Endo) of an adult Otx2flox/CreERT2 animal that received a single injection of tamoxifen (Tam) at E12.5. Haematoxylin–eosin staining (Q), calbindin immunofluorescence (white arrowheads) (R), GAD67 in situ hybridization (S) and calretinin immunofluorescence (T) on sagittal sections. Scale bar, 500 μm.
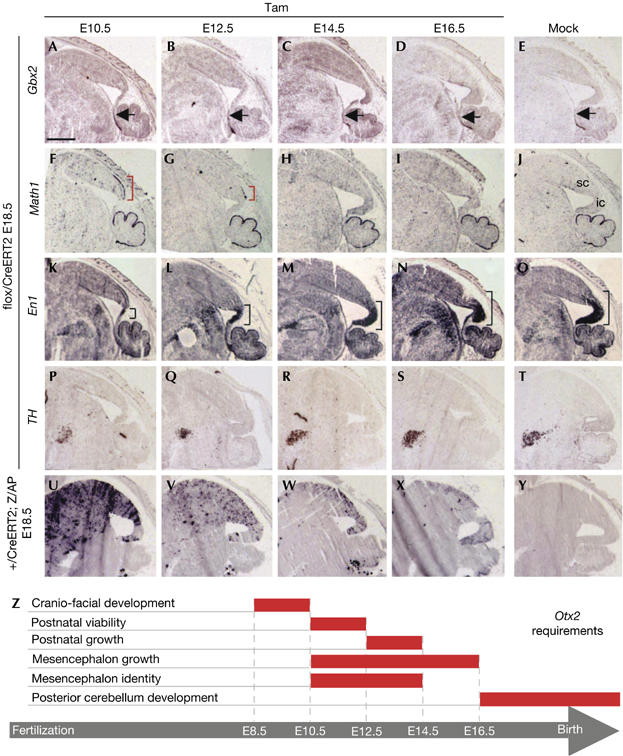
Midbrain specification under Otx2 temporal control. (A–T) In situ hybridization of sagittal sections of embryonic day (E)18.5 brains from Otx2flox/CreERT2 embryos that received tamoxifen (Tam) at indicated times or solvent (Mock) with Gbx2 (A–E), Math1 (F–J), En1 (K–O) and TH (P–T). Rostral limit of Gbx2 expression is marked by black arrows. Ectopic Math1 expression is marked by red brackets. En1 labelling extension is indicated by black brackets. cb, cerebellum; ic, inferior colliculus; sc, superior colliculus. (U–Y) Alkaline phosphatase activity in sagittal sections of E18.5 Otx2+/CreERT2 ; Z/AP animals that received tamoxifen at time corresponding to the panels above. Scale bar, 1 mm. (Z) Schematic representation of the temporal and spatial delineation (red bars) of the multiple requirements of Otx2 during the later stages of embryonic development.
Similar articles
-
A new GFP-tagged line reveals unexpected Otx2 protein localization in retinal photoreceptors.BMC Dev Biol. 2007 Nov 2;7:122. doi: 10.1186/1471-213X-7-122. BMC Dev Biol. 2007. PMID: 17980036 Free PMC article.
-
Otx2 expression is restricted to dopaminergic neurons of the ventral tegmental area in the adult brain.Int J Dev Biol. 2010;54(5):939-45. doi: 10.1387/ijdb.092974ms. Int J Dev Biol. 2010. PMID: 19924631
-
Generation of aggrecan-CreERT2 knockin mice for inducible Cre activity in adult cartilage.Genesis. 2009 Dec;47(12):805-14. doi: 10.1002/dvg.20564. Genesis. 2009. PMID: 19830818 Free PMC article.
-
Brain development is a multi-level regulated process--the case of the OTX2 gene.Pediatr Endocrinol Rev. 2011 Sep;9(1):422-30. Pediatr Endocrinol Rev. 2011. PMID: 22783640 Review.
-
The homeobox gene Otx2 in development and disease.Exp Eye Res. 2013 Jun;111:9-16. doi: 10.1016/j.exer.2013.03.007. Epub 2013 Mar 21. Exp Eye Res. 2013. PMID: 23523800 Review.
Cited by
-
A new GFP-tagged line reveals unexpected Otx2 protein localization in retinal photoreceptors.BMC Dev Biol. 2007 Nov 2;7:122. doi: 10.1186/1471-213X-7-122. BMC Dev Biol. 2007. PMID: 17980036 Free PMC article.
-
Animal Models in Psychiatric Disease: A Circuit-Search Approach.Harv Rev Psychiatry. 2018 Sep/Oct;26(5):298-303. doi: 10.1097/HRP.0000000000000193. Harv Rev Psychiatry. 2018. PMID: 30188341 Free PMC article. Review.
-
Aberrant Otx2 expression enhances migration and induces ectopic proliferation of hindbrain neuronal progenitor cells.PLoS One. 2012;7(4):e36211. doi: 10.1371/journal.pone.0036211. Epub 2012 Apr 27. PLoS One. 2012. PMID: 22558385 Free PMC article.
-
Haploinsufficiency of Homeodomain Proteins Six3, Vax1, and Otx2 Causes Subfertility in Mice via Distinct Mechanisms.Neuroendocrinology. 2019;109(3):200-207. doi: 10.1159/000494086. Epub 2018 Sep 27. Neuroendocrinology. 2019. PMID: 30261489 Free PMC article. Review.
-
Deletion of Otx2 in GnRH neurons results in a mouse model of hypogonadotropic hypogonadism.Mol Endocrinol. 2011 May;25(5):833-46. doi: 10.1210/me.2010-0271. Epub 2011 Mar 24. Mol Endocrinol. 2011. PMID: 21436260 Free PMC article.
References
-
- Acampora D, Mazan S, Lallemand Y, Avantaggiato V, Maury M, Simeone A, Brulet P (1995) Forebrain and midbrain regions are deleted in Otx2−/− mutants due to a defective anterior neuroectoderm specification during gastrulation. Development 121: 3279–3290 - PubMed
-
- Ang SL, Jin O, Rhinn M, Daigle N, Stevenson L, Rossant J (1996) A targeted mouse Otx2 mutation leads to severe defects in gastrulation and formation of axial mesoderm and to deletion of rostral brain. Development 122: 243–252 - PubMed
-
- Di C et al. (2005) Identification of OTX2 as a medulloblastoma oncogene whose product can be targeted by all-trans retinoic acid. Cancer Res 65: 919–924 - PubMed
-
- Feil R, Wagner J, Metzger D, Chambon P (1997) Regulation of Cre recombinase activity by mutated estrogen receptor ligand-binding domains. Biochem Biophys Res Commun 237: 752–757 - PubMed
-
- Foucher I, Mione M, Simeone A, Acampora D, Bally-Cuif L, Houart C (2006) Differentiation of cerebellar cell identities in absence of Fgf signalling in zebrafish Otx morphants. Development 133: 1891–1900 - PubMed
Publication types
MeSH terms
Substances
LinkOut - more resources
Full Text Sources
Other Literature Sources
Molecular Biology Databases
