. 2006 Aug;9(8):1041-9.
doi: 10.1038/nn1740. Epub 2006 Jul 16.

BK calcium-activated potassium channels regulate circadian behavioral rhythms and pacemaker output

Affiliations

BK calcium-activated potassium channels regulate circadian behavioral rhythms and pacemaker output

Andrea L Meredith et al. Nat Neurosci. 2006 Aug.

Erratum in

  • Nat Neurosci. 2006 Sep;9(9):1193

Abstract

Spontaneous action potentials in the suprachiasmatic nucleus (SCN) are necessary for normal circadian timing of behavior in mammals. The SCN exhibits a daily oscillation in spontaneous firing rate (SFR), but the ionic conductances controlling SFR and the relationship of SFR to subsequent circadian behavioral rhythms are not understood. We show that daily expression of the large conductance Ca(2+)-activated K(+) channel (BK) in the SCN is controlled by the intrinsic circadian clock. BK channel-null mice (Kcnma1(-/-)) have increased SFRs in SCN neurons selectively at night and weak circadian amplitudes in multiple behaviors timed by the SCN. Kcnma1(-/-) mice show normal expression of clock genes such as Arntl (Bmal1), indicating a role for BK channels in SCN pacemaker output, rather than in intrinsic time-keeping. Our findings implicate BK channels as important regulators of the SFR and suggest that the SCN pacemaker governs the expression of circadian behavioral rhythms through SFR modulation.


Conflict of interest statement

COMPETING INTERESTS STATEMENT

The authors declare that they have no competing financial interests.

Figures
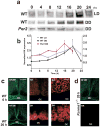
Figure 1
Figure 1
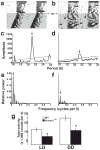
BK channel expression in the SCN. (a) Representative α-BK western blots from wild-type and Per2 mice in light-dark and constant darkness conditions. Each lane contains protein from the SCN of an individual mouse at the indicated time point (light = 0–12 h, dark = 12–24 h). (b) Normalized α-BK signal ± s.e.m. as a proportion of the value at time = 0 h, for wild-type mice in constant darkness (left axis), and for wild-type mice in light-dark and Per2 mice in constant darkness (right axis) (different axes for ease of visualization of the relative differences within each condition. The wild-type 24-h constant darkness value is replotted from that at 0 h. (c,d) Coronal tissue sections through the ventral hypothalamus. Neurofilament 200 (NF200, green) and α-BK (red) staining of the same section harvested at 6 h or 20 h. α-BK panels were equivalently exposed (500 ms) for comparison of staining intensity. Scale bars: in c, 250 μm in left and middle panels, 10 μm in right panels; in d, 10 μm. OC, optic chiasm; LD, light-dark; DD, constant darkness; WT, wild type.
Figure 2
Figure 2
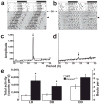
Records of locomotor wheel-running activity. (a,b) Activity was measured from wild-type (a) and Kcnma1−/− (b) mice on an F2 (FVB/NJ) × (C57BL/6J/129) strain background for 8 d in the light-dark condition and for 14 d in constant darkness (shaded area). Actograms are double-plotted on a 48-h axis; dark bars at top indicate lights out in the light-dark condition. (c,d2 periodograms for wild-type (c) and Kcnma1−/− (d) mice, generated from activity data in a and b. There was a dominant circadian peak for both genotypes (23.33 h and 23.83 h, respectively). The line denotes the 0.001 confidence interval. Group averages for all circadian statistics are presented in Table 1. (e,f) Fourier analysis for wild-type (e) and Kcnma1−/− (f) mice, obtained from activity data in a and b. Arrows at 0.04 cycles per h correspond to the dominant 24-h rhythm. The amplitude of the circadian component was 0.168 for wild-type mice and 0.054 for Kcnma1−/− mice. (g) Averaged summed total wheel-running activity per day ± s.e.m. for wild-type and Kcnma1−/− mice in light-dark and constant darkness conditions. *P < 0.05.
Figure 3
Figure 3
Home-cage activity records. (a,b) Activity of FVB/NJ wild-type (a) and Kcnma1−/− (b) mice was measured by motion sensors for 10 d in the light-dark condition and for 28 d in constant darkness (shaded area). Actograms are plotted as in Figure 2. Arrowheads indicate a 3-d gap in the data. (c,d) χ2 periodograms for wild-type (c) and Kcnma1−/− (d) mice, plotted from the activity data. The dominant peaks are at 23.71 h and 24.00 h, respectively. The line denotes the 0.001 confidence interval. (e) Averaged summed total activity per day ± s.e.m. for wild-type and Kcnma1−/− mice in light-dark and constant darkness conditions (left axis). Average daily activity bouts in constant darkness (right axis), defined as a continuous 60-min period during which the activity stayed above 4 counts per min. *P < 0.05.
Figure 4
Figure 4
Responses of Kcnma1−/− mice to light. (a,b) Motion sensor activity records of FVB/NJ wild-type (a) and Kcnma1−/− (b) mice. Mice were entrained to a standard light-dark cycle for 2 weeks (initial light-dark cycle denoted by bars at top). The light-dark cycle was then advanced 6 h during the light phase (top arrow, bars at bottom indicate new light-dark cycle). Bottom arrows mark stable entrainment after the light-dark cycle was advanced. (c,d) Motion sensor activity records from wild-type (c) and Kcnma1−/− (d) mice housed in constant darkness for 2 weeks. A 30-min light pulse was delivered 4 h after activity onset in subjective night (arrow). Group averages for re-entrainment and light pulses reported in Table 1.
Figure 5
Figure 5
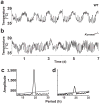
Core body temperature (Tcore) measurements. (a,b) Following transmitter implantation, FVB/NJ wild-type and Kcnma1−/− mice were stably entrained to a standard light-dark cycle for 1 week and were placed in constant darkness for 1 week. (c,d) χ2 periodograms for wild-type (c) and Kcnma1−/− (d) mice, plotted from the Tcore data obtained in constant darkness. The dominant peaks are at 23.90 h and 23.88 h, respectively. The line denotes the 0.001 confidence interval.
Figure 6
Figure 6
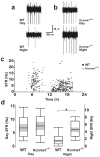
SCN neuronal spontaneous firing rates (SFR). (a,b) Representative traces of single-unit activity from SCN neurons of FVB/NJ wild-type and Kcnma1−/− mice. Mice were housed in a standard light-dark cycle before slice preparation. Traces at top were obtained at the daytime SFR peak (4–8 h). Traces at bottom were obtained during the night (12–24 h). (c) Single-unit activity in wild-type and Kcnma1−/− mice. Each frequency measurement represents a single electrode placement monitoring the SFR continuously for 1.5–5 mins. (d) Box plots showing the 25th and 75th percentile limits (white) and 95% confidence intervals (gray) about the medians (thick line). Whiskers represent 1.5 × interquartile range. Averages are reported in Results. Medians for subjective day were 7.3 Hz for wild type and 8.0 Hz for Kcnma1−/− neurons. At night, medians were 1.8 Hz for wild type and 4.9 Hz for the Kcnma1−/− neurons. *P < 0.05.
Figure 7
Figure 7
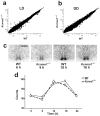
Gene expression in the SCNs of Kcnma1−/− and wild-type mice. (a,b) Representative Kcnma1−/− versus wild-type pairwise comparisons of hypothalamic transcript expression from light-dark and constant darkness conditions at 20 h. (c) Arntl expression detected by in situ hybridization of coronal SCN sections. Mice were housed in constant darkness and brains were harvested at the indicated time point. Scale bar, 500μm. (d) Arntl expression was averaged between right and left SCNs, and counts were normalized to background expression in the hypothalamus and then averaged together into a group value ± s.e.m. P = 0.03 at 18 h.

Comment in

Similar articles

Cited by

References

    1. King DP, Takahashi JS. Molecular genetics of circadian rhythms in mammals. Annu Rev Neurosci. 2000;23:713–742. - PubMed
    1. Reppert SM, Weaver DR. Coordination of circadian timing in mammals. Nature. 2002;418:935–941. - PubMed
    1. Hastings MH, Herzog ED. Clock genes, oscillators, and cellular networks in the suprachiasmatic nuclei. J Biol Rhythms. 2004;19:400–413. - PubMed
    1. Panda S, et al. Coordinated transcription of key pathways in the mouse by the circadian clock. Cell. 2002;109:307–320. - PubMed
    1. Ueda HR, et al. System-level identification of transcriptional circuits underlying mammalian circadian clocks. Nat Genet. 2005;37:187–192. - PubMed

Publication types

MeSH terms

Substances