A novel family of diversified immunoregulatory receptors in teleosts is homologous to both mammalian Fc receptors and molecules encoded within the leukocyte receptor complex
- PMID: 16845542
- PMCID: PMC1592254
- DOI: 10.1007/s00251-006-0134-1
A novel family of diversified immunoregulatory receptors in teleosts is homologous to both mammalian Fc receptors and molecules encoded within the leukocyte receptor complex
Abstract
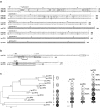
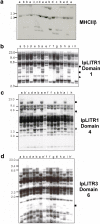
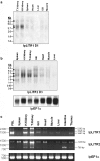
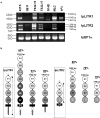
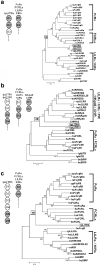
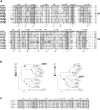
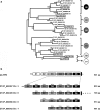
Three novel and closely related leukocyte immune-type receptors (IpLITR) have been identified in channel catfish (Ictalurus punctatus). These receptors belong to a large polymorphic and polygenic subset of the Ig superfamily with members located on at least three independently segregating loci. Like mammalian and avian innate immune regulatory receptors, IpLITRs have both putative inhibitory and stimulatory forms, with multiple types coexpressed in various lymphoid tissues and clonal leukocyte cell lines. IpLITRs have an unusual and novel relationship to mammalian and avian innate immune receptors: the membrane distal Ig domains of an individual IpLITR are related to fragment crystallizable receptors (FcRs) and FcR-like proteins, whereas the membrane proximal Ig domains are related to several leukocyte receptor complex encoded receptors. This unique composition of Ig domains within individual receptors supports the hypothesis that functionally and genomically distinct immune receptor families found in tetrapods may have evolved from such ancestral genes by duplication and recombination events. Furthermore, the discovery of a large heterogeneous family of immunoregulatory receptors in teleosts, reminiscent of amphibian, avian, and mammalian Ig-like receptors, suggests that complex innate immune receptor networks have been conserved during vertebrate evolution.
Figures
Similar articles
-
Channel catfish leukocyte immune-type receptors contain a putative MHC class I binding site.Immunogenetics. 2007 Jan;59(1):77-91. doi: 10.1007/s00251-006-0169-3. Epub 2006 Dec 6. Immunogenetics. 2007. PMID: 17149620
-
Imaging flow cytometry and GST pulldown assays provide new insights into channel catfish leukocyte immune-type receptor-mediated phagocytic pathways.Dev Comp Immunol. 2017 Feb;67:126-138. doi: 10.1016/j.dci.2016.10.011. Epub 2016 Oct 28. Dev Comp Immunol. 2017. PMID: 27984101
-
Teleost leukocyte immune-type receptors activate distinct phagocytic modes for target acquisition and engulfment.J Leukoc Biol. 2015 Aug;98(2):235-48. doi: 10.1189/jlb.2A0215-039RR. Epub 2015 May 14. J Leukoc Biol. 2015. PMID: 25977286
-
Identification of distinct LRC- and Fc receptor complex-like chromosomal regions in fish supports that teleost leukocyte immune-type receptors are distant relatives of mammalian Fc receptor-like molecules.Immunogenetics. 2021 Feb;73(1):93-109. doi: 10.1007/s00251-020-01193-3. Epub 2021 Jan 7. Immunogenetics. 2021. PMID: 33410929 Review.
-
The chicken leukocyte receptor cluster.Vet Immunol Immunopathol. 2011 Nov 15;144(1-2):1-10. doi: 10.1016/j.vetimm.2011.07.001. Epub 2011 Jul 7. Vet Immunol Immunopathol. 2011. PMID: 21794927 Review.
Cited by
-
A bony fish immunological receptor of the NITR multigene family mediates allogeneic recognition.Immunity. 2008 Aug 15;29(2):228-37. doi: 10.1016/j.immuni.2008.05.018. Epub 2008 Jul 31. Immunity. 2008. PMID: 18674935 Free PMC article.
-
A Fish Leukocyte Immune-Type Receptor Uses a Novel Intracytoplasmic Tail Networking Mechanism to Cross-Inhibit the Phagocytic Response.Int J Mol Sci. 2020 Jul 21;21(14):5146. doi: 10.3390/ijms21145146. Int J Mol Sci. 2020. PMID: 32708174 Free PMC article.
-
Biochemical and Functional Insights into the Integrated Regulation of Innate Immune Cell Responses by Teleost Leukocyte Immune-Type Receptors.Biology (Basel). 2016 Mar 8;5(1):13. doi: 10.3390/biology5010013. Biology (Basel). 2016. PMID: 27005670 Free PMC article. Review.
-
Expression analysis of Carassius auratus-leukocyte-immune-type receptors (CaLITRs) during goldfish kidney macrophage development and in activated kidney leukocyte cultures.Immunogenetics. 2023 Apr;75(2):171-189. doi: 10.1007/s00251-023-01298-5. Epub 2023 Feb 18. Immunogenetics. 2023. PMID: 36806761
-
Spotted Gar and the Evolution of Innate Immune Receptors.J Exp Zool B Mol Dev Evol. 2017 Nov;328(7):666-684. doi: 10.1002/jez.b.22738. Epub 2017 May 24. J Exp Zool B Mol Dev Evol. 2017. PMID: 28544607 Free PMC article.
References
-
- {'text': '', 'ref_index': 1, 'ids': [{'type': 'PubMed', 'value': '2231712', 'is_inner': True, 'url': 'https://pubmed.ncbi.nlm.nih.gov/2231712/'}]}
- Altschul SF, Gish W, Miller W, Meyers EW, Lipman DJ (1990) Basic local alignment search tool. J Mol Biol 215:403–410 - PubMed
-
- {'text': '', 'ref_index': 1, 'ids': [{'type': 'DOI', 'value': '10.1093/nar/gkh121', 'is_inner': False, 'url': 'https://doi.org/10.1093/nar/gkh121'}, {'type': 'PMC', 'value': 'PMC308855', 'is_inner': False, 'url': 'https://pmc.ncbi.nlm.nih.gov/articles/PMC308855/'}, {'type': 'PubMed', 'value': '14681378', 'is_inner': True, 'url': 'https://pubmed.ncbi.nlm.nih.gov/14681378/'}]}
- Bateman A, Coin L, Durbin R, Finn RD, Hollich V, Griffiths-Jones S, Khanna A, Marshall M, Moxon S, Sonnhammer EL, Studholme DJ, Yeats C, Eddy SR (2004) The Pfam protein families database. Nucleic Acids Res 32:D138–D141 - PMC - PubMed
-
- {'text': '', 'ref_index': 1, 'ids': [{'type': 'PMC', 'value': 'PMC150845', 'is_inner': False, 'url': 'https://pmc.ncbi.nlm.nih.gov/articles/PMC150845/'}, {'type': 'PubMed', 'value': '11805126', 'is_inner': True, 'url': 'https://pubmed.ncbi.nlm.nih.gov/11805126/'}]}
- Billadeau DD, Leibson PJ (2002) ITAMs versus ITIMs: striking a balance during cell regulation. J Clin Invest 109:161–168 - PMC - PubMed
-
- {'text': '', 'ref_index': 1, 'ids': [{'type': 'DOI', 'value': '10.1007/BF02618357', 'is_inner': False, 'url': 'https://doi.org/10.1007/bf02618357'}, {'type': 'PubMed', 'value': '7390534', 'is_inner': True, 'url': 'https://pubmed.ncbi.nlm.nih.gov/7390534/'}]}
- Browser PR, Plumb JA (1980) Fish cell lines: establishment of a line from ovaries of channel catfish. In Vitro 16:365–368 - PubMed
-
- {'text': '', 'ref_index': 1, 'ids': [{'type': 'DOI', 'value': '10.1016/0145-305X(86)90176-X', 'is_inner': False, 'url': 'https://doi.org/10.1016/0145-305x(86)90176-x'}, {'type': 'PubMed', 'value': '3817250', 'is_inner': True, 'url': 'https://pubmed.ncbi.nlm.nih.gov/3817250/'}]}
- Coosemans V, Hadji-Azimi I (1986) Partial characterization of different cell types found in the Xenopus laevis lymphoreticular tumor based on the presence or absence of surface immunoglobulins and Fc molecules. Dev Comp Immunol 10:547–549 - PubMed
Publication types
MeSH terms
Substances
Associated data
- Actions
- Actions
- Actions
Grants and funding
LinkOut - more resources
Full Text Sources

