. 2006 Jul 25;45(29):8841-54.
doi: 10.1021/bi060247u.

Initial transcribed sequence mutations specifically affect promoter escape properties

Affiliations

Initial transcribed sequence mutations specifically affect promoter escape properties

Lilian M Hsu et al. Biochemistry. .

Abstract

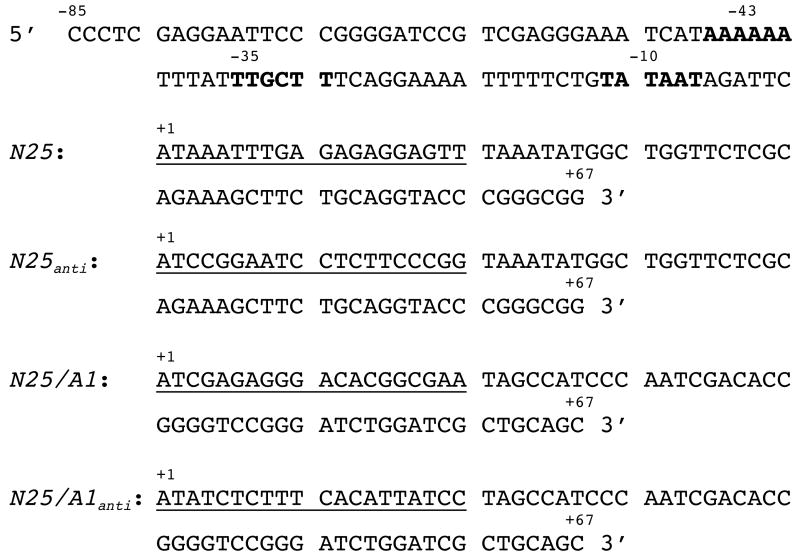
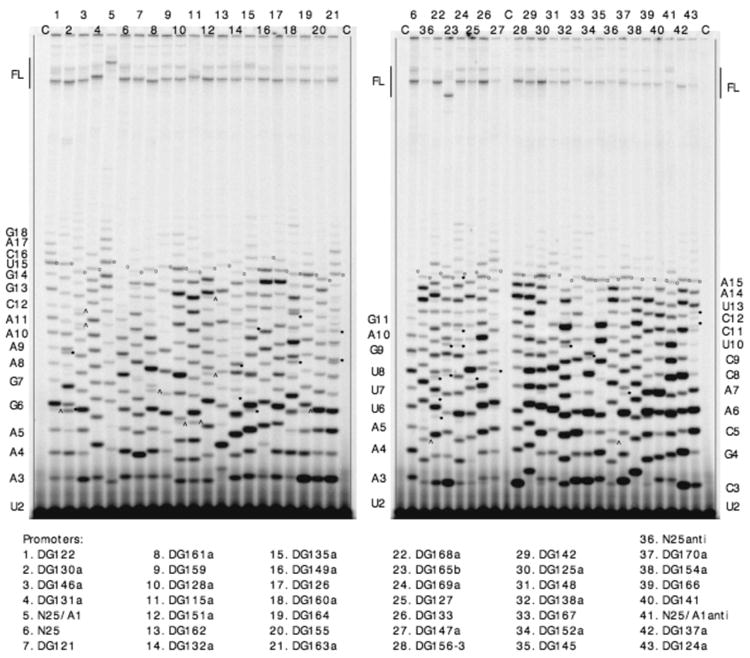
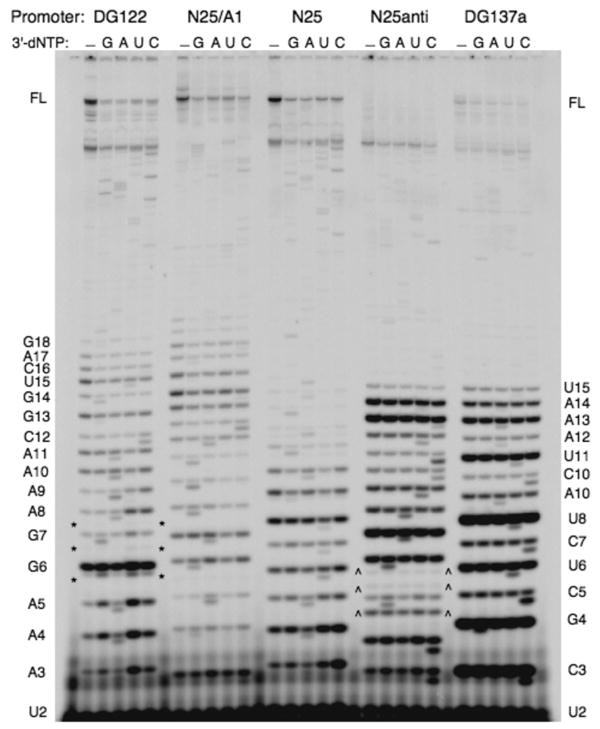
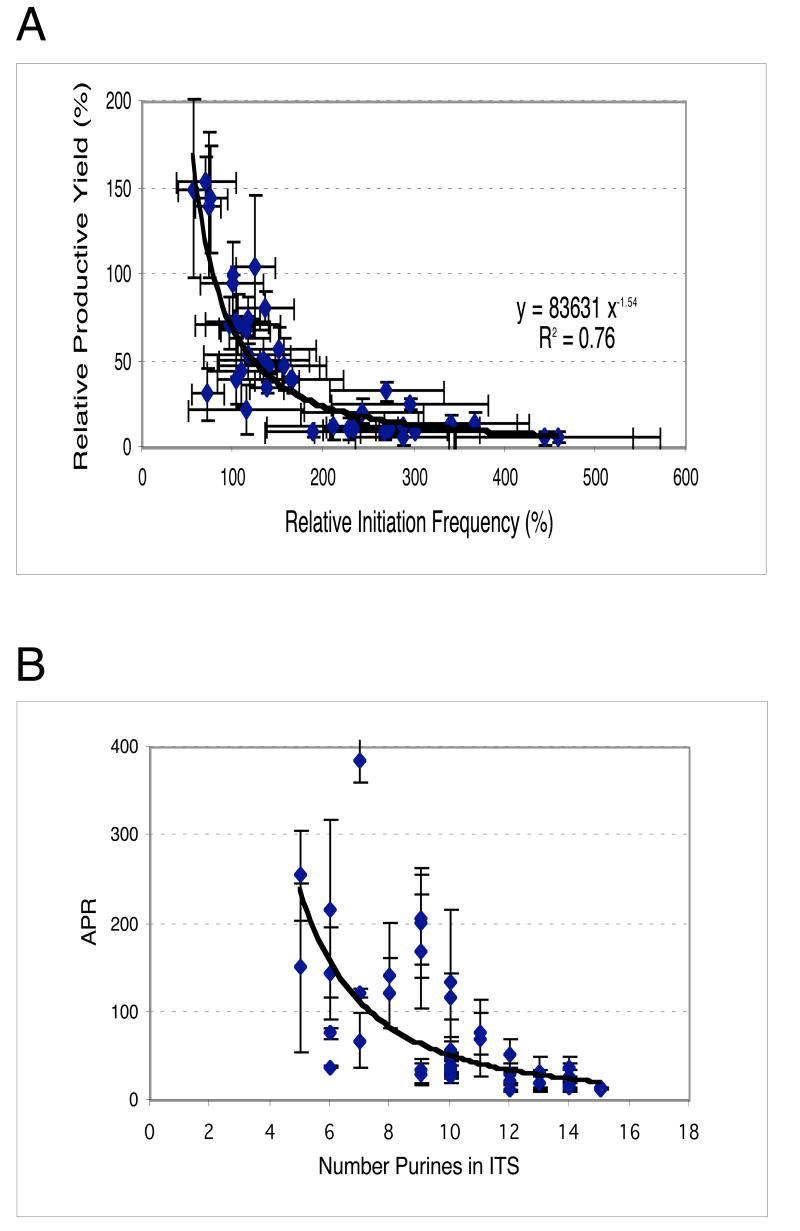
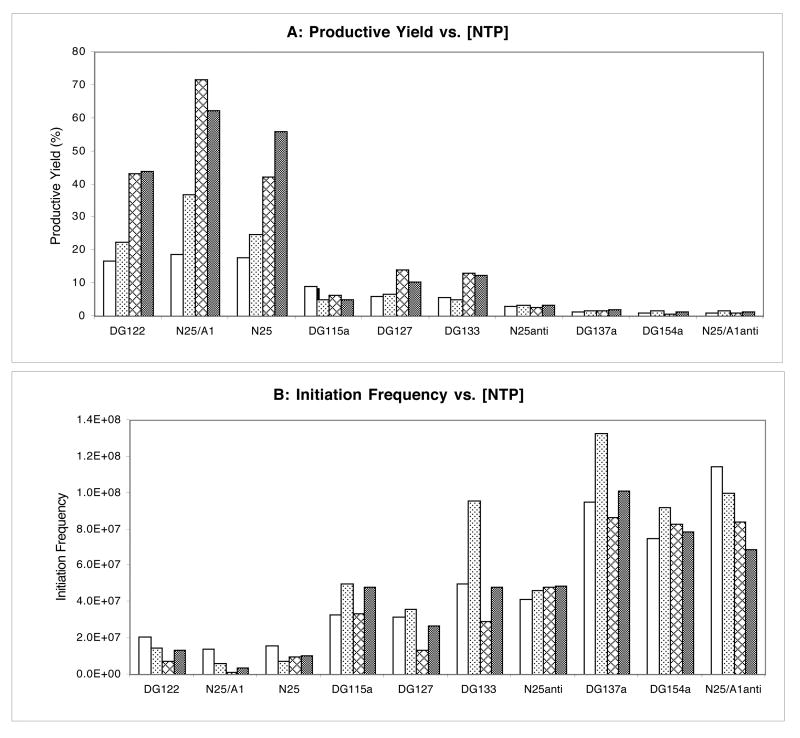
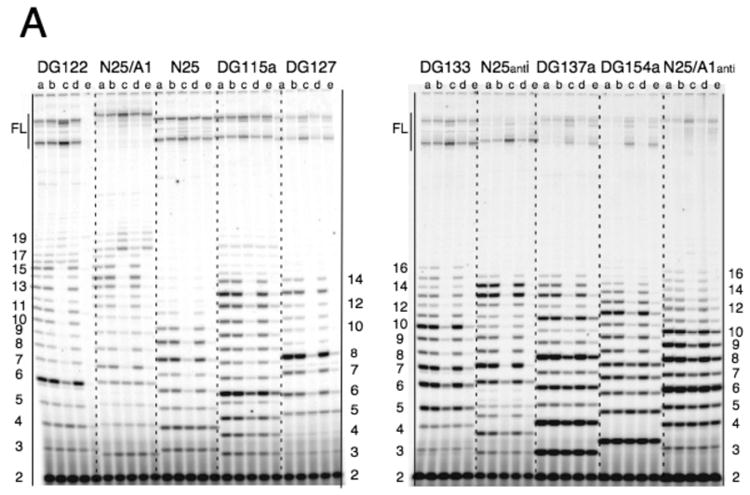
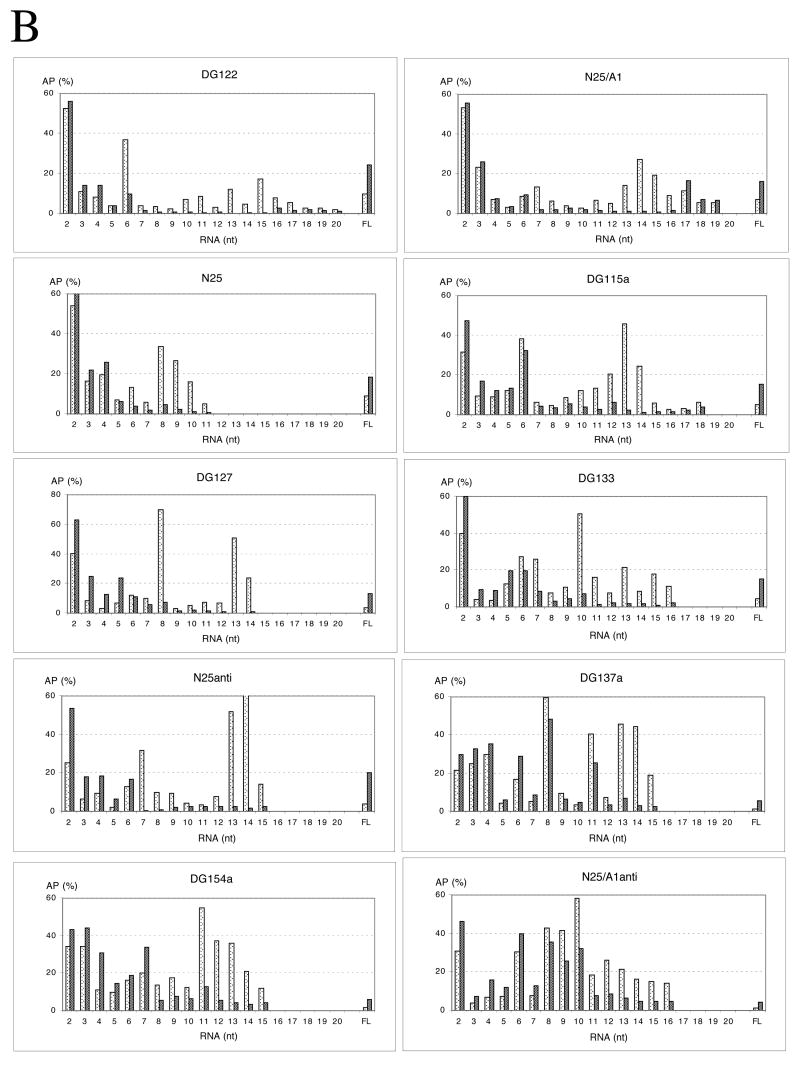
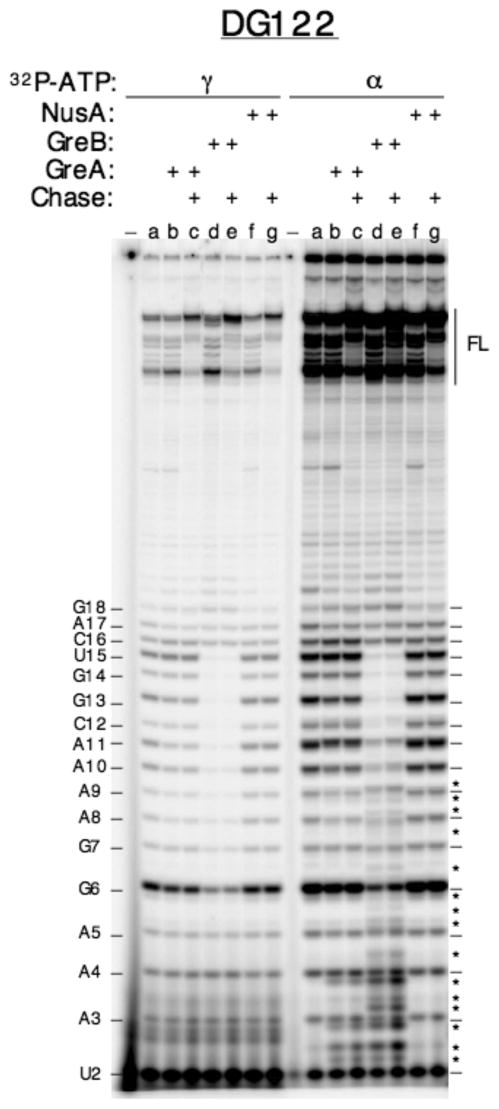
Promoter escape efficiency of E. coli RNA polymerase is guided by both the core promoter and the initial transcribed sequence (ITS). Here, we quantitatively examined the escape properties of 43 random initial sequence variants of the phage T5 N25 promoter. The position for promoter escape on all N25-ITS variants occurred at the +15/+16 juncture, unlike the +11/+12 juncture for the wild type N25. These variants further exhibited a 25-fold difference in escape efficiency. ITS changes favoring promoter escape showed a compositional bias that is unrelated to nucleotide substrate binding affinity for the initial positions. Comparing all variants, the natural N25 promoter emerges as having evolved an ITS optimal for promoter escape, giving a high level of productive synthesis after undergoing the shortest abortive program. We supplemented GreB to transcription reactions to better understand abortive initiation and promoter escape in vivo. GreB supplementation elevated productive RNA synthesis 2-5-fold by altering the abortive RNA pattern, decreasing the abundance of the medium (6-10 nt) to long (11-15 nt) abortive RNAs without changing the levels of short (2-5 nt) and very long abortive RNAs (16-20 nt). The GreB-refractive nature of short abortive RNA production may reflect a minimum length requirement of 4-5 bp of the RNA-DNA hybrid for maintaining the stability of initial or backtracked complexes. That the very long abortive RNAs are unaffected by GreB suggests that they are unlikely to be products of polymerase backtracking. How the ITS might influence the course of early transcription is discussed within the structural context of an initial transcribing complex.


Figures

Fig. 1
Fig. 1
Nucleotide sequence of T5 N25 and related promoters. The four promoters – N25, N25anti, N25/A1, and N25/A1anti -- span −85 to +67 and share the identical upstream sequence from −85 to −1, but differ in the downstream sequence (+1 to +67). The ITS of each promoter is underlined (+1 to +20). The promoter recognition sequences highlighted in bold include the UP (centered at −43), −35 and −10 elements.
Fig. 2
Fig. 2
Gel profile of in vitro transcribed RNAs from the N25 random-ITS variants. In vitro transcribed RNAs, 32P-labeled at the 5′-triphosphate, were prepared from 43 random-ITS promoters and fractionated on 25% (10:1)/7 M urea polyacrylamide gels. Abortive RNAs are designated by a letter-number combination indicating the identity of its 3′-most nucleotide and length. The abortive RNA ladder on the left border corresponds to lane 1; the middle ladder, to lane 6 (in both gels); and the right ladder, to lane 43. The full-length runoff RNA (FL) is 67 nt for all promoters except DG165b (lane 23), which is 54 nt (due to a 13-nt deletion far downstream of the ITS region). For N25/A1 (lane 5), the 67-nt runoff RNA migrates slower because of sequence composition differences. “C” denotes minus-enzyme control reactions to reveal the background of [γ-32P]-ATP later subtracted from the relevant abortive RNA bands during ImageQuant analysis. For ease of monitoring, the 15-nt band in each lane is marked with an open dot. Extraneous bands attributed to slippage are indicated by carets; to misincorporation, by asterisks.
Fig. 3
Fig. 3
Sequencing the abortive RNAs by chain termination. A high percentage denaturing PAGE (as used for Fig. 2) displays the abortive RNA ladders from five promoters. Each promoter is reacted during steady state transcription (in 100 μM NTP) for 10 min at 37 °C under five conditions -- in the absence or presence of 100 μM of the specified 3′-dNTP (indicated by G, A, U, or C). In the lanes containing a 3′-dNTP, the 3′-dNMP-terminated abortive RNAs migrate just ahead of their regular abortive RNA counterparts, forming doublet bands. The abortive RNA sequence obtained from these five promoters agree with the DNA sequence of their ITS. Under the nucleotide concentrations used, slippage transcripts – for example, C5 (and C6 and C7) in N25anti (bounded by carets) and A6 (and A7 and A8) of DG122 (bounded by asterisks) -- do not undergo chain termination by incorporating the corresponding 3′dNMP. Abortive RNA ladder on the left border is that of DG122; on the right, that of DG137a.
Fig. 4
Fig. 4
Promoter escape efficiency varies with the ITS sequence. A: For each N25-random ITS promoter, escape efficiency as indicated by the relative productive yield (mean ± SD) shows an inverse correlation with relative initiation frequency (mean ± SD). B: A positive correlation was found between the relative productive yield and purine content in the NT strand of the ITS. Here, the equivalent negative correlation of APR (± SD) with purine content is plotted.
Fig. 5
Fig. 5
Promoter escape efficiency as a function of NTP concentration. NTP titration was performed with ten selected promoters; three with high purine content in the NT strand of their ITS: DG122, N25/A1 and N25; three with intermediate purine content: DG115a, DG127, and DG133; and four with high pyrimidine content: N25anti, DG137a, DG154a, and N25/A1anti. Each promoter was transcribed for 10 min at 37 °C in four different NTP conditions: a, 100 μM NTP; b, 100 μM ATP/GTP, 500 μM CTP/UTP; c, 500 μM ATP/GTP, 100 μM CTP/UTP; and d, 500 μM NTP. All reactions used [γ-32P]-ATP label at the same specific activity. A. Histogram of productive transcription as a function of NTP conditions: a, open bars; b, dotted bars; c, cross-hatched bars; d, stippled bars. B. Histogram of total initiation frequency as a function of NTP concentration. Initiation frequency is measured in IQ volume units.
Fig. 6
Fig. 6
Effect of GreB and NusA on promoter escape from selected promoters. A. Gel profile of transcripts from the ten promoters examined in Figure 5. Each promoter was transcribed with five different enzyme mixtures for 10 min at 37 °C. The transcripts were labeled with [γ-32P]-ATP. Enzymatic conditions were: (a) A-B- RNAP; (b) wt RNAP; (c) wt RNAP:GreB (1:10); (d) wt RNAP:NusA (1:10); and (e) wt RNAP:GreB:NusA (1:10:10). RNAP was preincubated for 10 min at room temperature with the accessory protein(s) prior to its addition to the reaction. Columns of numbers reference the size of abortive RNAs associated with the nearest promoters. FL: full-length RNA. B. Comparative abortive probability profiles for the ten promoters. Abortive probabilities were calculated for the abortive RNAs (26) and plotted. The higher the abortive probability, the more likely is the RNAP to release its nascent transcript at that position. High abortive probability percentages represent high barriers to promoter escape. Dotted bars: -GreB; stippled bars: +GreB.
Fig. 6
Fig. 6
Effect of GreB and NusA on promoter escape from selected promoters. A. Gel profile of transcripts from the ten promoters examined in Figure 5. Each promoter was transcribed with five different enzyme mixtures for 10 min at 37 °C. The transcripts were labeled with [γ-32P]-ATP. Enzymatic conditions were: (a) A-B- RNAP; (b) wt RNAP; (c) wt RNAP:GreB (1:10); (d) wt RNAP:NusA (1:10); and (e) wt RNAP:GreB:NusA (1:10:10). RNAP was preincubated for 10 min at room temperature with the accessory protein(s) prior to its addition to the reaction. Columns of numbers reference the size of abortive RNAs associated with the nearest promoters. FL: full-length RNA. B. Comparative abortive probability profiles for the ten promoters. Abortive probabilities were calculated for the abortive RNAs (26) and plotted. The higher the abortive probability, the more likely is the RNAP to release its nascent transcript at that position. High abortive probability percentages represent high barriers to promoter escape. Dotted bars: -GreB; stippled bars: +GreB.
Fig. 7
Fig. 7
GreB-mediated rescue of medium and long abortive RNAs results from cleavage and re-extension. Cleavage of backtracked complexes leads to the formation of 3′ cleaved RNAs whose presence is only detected in reactions containing [α-32P]-NTP. Two sets of transcription reactions were performed in parallel, one with [γ-32P]-ATP label (left half) and the other with [α-32P]-ATP label (right half). Each set of seven reactions corresponds to transcription of DG122 for 10 min at 37 °C by RNAP alone (lane a), or RNAP supplemented with 10-fold molar excess of GreA (lanes b and c), GreB (lanes d and e), or NusA (lanes f and g), followed by a 10 min chase with 1 mM NTP (lanes c, e, and g); “−“ represents minus-enzyme control. The high [NTP] chase was included to distinguish released vs. paused RNAs. [α-32P]-AMP labeling reveals the presence of 3′-cleavage products in reactions containing GreA or GreB (lanes b-e, right half). Asterisks mark the 3′-cleavage products that are 5′-monophosphorylated; they migrate slower than their 5′-triphosphorylated abortive RNA counterparts during PAGE and reach positions between the abortive RNA bands – marked with dashes on both edges of the gel -- of the nearest sizes (i.e. a 5′-p-3 mer will form a band between the 5′-ppp-3 mer and 5′-ppp-4 mer; Hsu, L. M., unpublished analysis). Multiple 5′-p-3 mer bands result from cleavage of different backtracked RNAs, giving rise to 3-mer cleavage products of different compositions (Hsu, unpublished results).
Fig. 8
Fig. 8
Bubble translocation during the initiation-elongation transition is mediated by bubble expansion during initial transcription followed by upstream bubble collapse. An integrated view of promoter escape is described in the text. This diagram illustrates the translocation of the open complex bubble to an elongation complex bubble, via expanded bubble intermediates formed during initial transcription. The expanded bubble intermediate depicted is one that has transcribed 13-14 nucleotides and on the verge of undergoing the escape transition. Subunits of RNAP are rendered in color as follows: gray, α; pink, β′; blue, β (made transparent to reveal features in the active site channel); and red, σ. Purple dots denote the twin Mg+2 catalytic center. Color scheme for nucleic acids: NT strand, green; T strand, blue; RNA, purple. The open complex bubble, which becomes the upstream portion of the expanded bubble, is highlighted with thick lines. The ITS region maps to the downstream portion of the expanded bubble and, upon escape, becomes the elongation bubble; it is indicated with the thickest lines.

Similar articles

Cited by

References

    1. Cheetham GM, Jeruzalmi D, Steitz TA. Structural basis for initiation of transcription from an RNA polymerase-promoter complex. Nature. 1999;399:80–83. - PubMed
    1. Cheetham GM, Steitz TA. Structure of a transcribing T7 RNA polymerase initiation complex. Science. 1999;286:2305–2309. - PubMed
    1. Yin YW, Steitz TA. Structural basis for the transition from initiation to elongation transcription in T7 RNA polymerase. Science. 2002;298:1387–1395. - PubMed
    1. Tahirov TH, Temiakov D, Patlan AM, McAllister WT, Vassylyev DG, Yokoyama S. Structure of a T7 RNA polymerase elongation complex at 2.9 Å resolution. Nature. 2002;420:43–50. - PubMed
    1. Murakami KS, Masuda S, Campbell EA, Mussin O, Darst SA. Structural basis of transcription initiation: an RNA polymerase holoenzyme-DNA complex. Science. 2002;296:1285–1290. - PubMed

Publication types

MeSH terms

Substances