The beat goes on: rhythmic modulation of cortical potentials by imagined tapping
- PMID: 16846293
- PMCID: PMC2728777
- DOI: 10.1037/0096-1523.32.4.986
The beat goes on: rhythmic modulation of cortical potentials by imagined tapping
Abstract
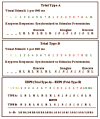
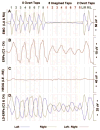
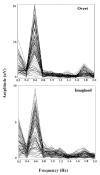
A frequency analysis was used to tag cortical activity from imagined rhythmic movements. Participants synchronized overt and imagined taps with brief visual stimuli presented at a constant rate, alternating between left and right index fingers. Brain potentials were recorded from across the scalp and topographic maps made of their power at the alternation frequency between left and right taps. Two prominent power foci occurred in each hemisphere for both overt and imagined taps, one over sensorimotor cortex and the other over posterior parietal cortex, with homologous foci in opposite hemispheres arising from oscillations 180 degrees out of phase. These findings demonstrate temporal isomorphism at a neural level between overt and imagined movements and illustrate a new approach to studying covert actions.
((c) 2006 APA, all rights reserved).
Figures


Similar articles
-
Linear classification of low-resolution EEG patterns produced by imagined hand movements.IEEE Trans Rehabil Eng. 2000 Jun;8(2):186-8. doi: 10.1109/86.847810. IEEE Trans Rehabil Eng. 2000. PMID: 10896181
-
Dynamic modulation of cortico-muscular coupling during real and imagined sensorimotor synchronisation.Neuroimage. 2021 Sep;238:118209. doi: 10.1016/j.neuroimage.2021.118209. Epub 2021 May 26. Neuroimage. 2021. PMID: 34051354
-
High-resolution ERD using realistic head geometry.Biomed Tech (Berl). 1998;43 Suppl:240-1. doi: 10.1515/bmte.1998.43.s1.240. Biomed Tech (Berl). 1998. PMID: 9859342 No abstract available.
-
Cerebral correlates of imagining colours, faces and a map--II. Negative cortical DC potentials.Neuropsychologia. 1990;28(1):81-93. doi: 10.1016/0028-3932(90)90088-6. Neuropsychologia. 1990. PMID: 2314566
-
[Review: lateral specialization of animal brains].Fiziol Zh SSSR Im I M Sechenova. 1980 Nov;66(11):1593-1607. Fiziol Zh SSSR Im I M Sechenova. 1980. PMID: 7002635 Review. Russian. No abstract available.
Cited by
-
Exploring how musical rhythm entrains brain activity with electroencephalogram frequency-tagging.Philos Trans R Soc Lond B Biol Sci. 2014 Dec 19;369(1658):20130393. doi: 10.1098/rstb.2013.0393. Philos Trans R Soc Lond B Biol Sci. 2014. PMID: 25385771 Free PMC article. Review.
-
Sensorimotor synchronization: a review of recent research (2006-2012).Psychon Bull Rev. 2013 Jun;20(3):403-52. doi: 10.3758/s13423-012-0371-2. Psychon Bull Rev. 2013. PMID: 23397235 Review.
-
Learning by observation requires an early sleep window.Proc Natl Acad Sci U S A. 2009 Nov 10;106(45):18926-30. doi: 10.1073/pnas.0901320106. Epub 2009 Nov 2. Proc Natl Acad Sci U S A. 2009. PMID: 19884499 Free PMC article.
-
Steady-state movement related potentials for brain-computer interfacing.IEEE Trans Biomed Eng. 2009 Aug;56(8):2104-13. doi: 10.1109/TBME.2009.2021529. Epub 2009 Apr 28. IEEE Trans Biomed Eng. 2009. PMID: 19403356 Free PMC article.
References
-
- American Electroencephalographic Society. Guidelines for standard electrode position nomenclature. Journal of Clinical Neurophysiology. 1991;8:200–201. - PubMed
-
- Andersen RA, Buneo CA. Intentional maps in posterior parietal cortex. Annual Review of Neuroscience. 2002;25:189–220. - PubMed
-
- Baddeley A. Working memory. Philisophical Transactions of the Royal Society of London. 1983;302B:311–24.
-
- Barsalou LW. Perceptual symbol systems. Behavioral and Brain Sciences. 1999;22:577–660. - PubMed
-
- Beisteiner R, Hollinger P, Lindinger G, Lang W, Berthoz A. Mental representations of movements: Brain potentials associated with imagination of hand movements. Electroencephalography and Clinical Neurophysiology. 1995;96(2):183–193. - PubMed

