. 2006 Jul;11(3):211-21.
doi: 10.1111/j.1542-474X.2006.00106.x.

Magnetocardiographic assessment of healed myocardial infarction

Affiliations

Magnetocardiographic assessment of healed myocardial infarction

Helena Hänninen et al. Ann Noninvasive Electrocardiol. 2006 Jul.

Abstract

Background: We evaluated the capability of multichannel magnetocardiography (MCG) to detect healed myocardial infarction (MI).

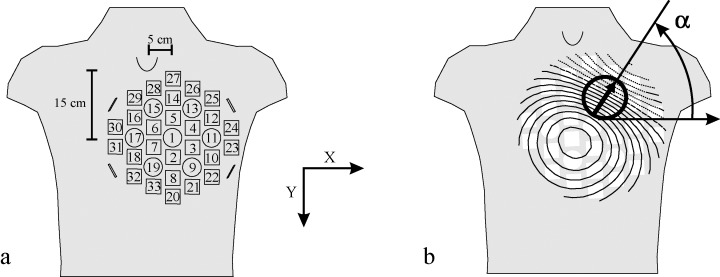
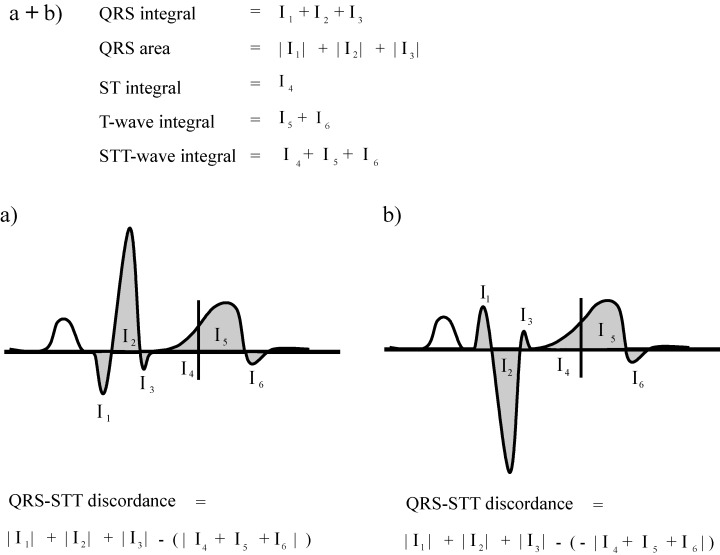
Methods: Multichannel MCG over frontal chest was recorded at rest in 21 patients with healed MI, detected by cine- and contrast-enhanced magnetic resonance imaging, and in 26 healthy controls. Of the 21 MI patients, 11 had non-Q wave and 10 Q wave MIs. QRS, ST-segment, T wave and ST-T wave integrals, ST-segment and T wave amplitudes, and QRS and ST-T wave magnetic field map orientations were measured.

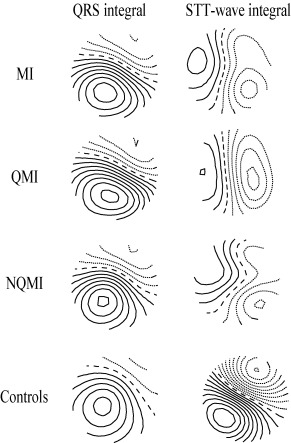
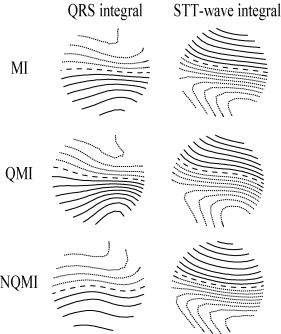
Results: The MCG repolarization indexes, such as ST segment and ST-T wave integrals, separated the MI group from the controls (ST-T wave integral -1.4 +/- 5.3 vs 1.5 +/- 4.7 pTs, P = 0.034). The abnormalities were more distinct in the Q wave-MI than in the non-Q wave MI subgroup. In the latter, however, a trend similar to the Q wave MI group was found. The relation of QRS area to ST segment and T wave integral improved the detection of healed MIs compared to the ST-T wave indexes alone (QRS-ST-T discordance 14 +/- 10 vs 5.0 +/- 7.1 pTs, P = 0.003). When comparing the MI group to the controls, the orientation of the magnetic field maps differed in the ST-T wave maps (163 +/- 119 degrees vs 58 +/- 17 degrees, P < 0.001) but not in the QRS maps (111 +/- 95 degrees vs 106 +/-93 degrees, P = 0.646).

Conclusions: The MCG repolarization variables can detect healed MI. These ST-T wave abnormalities are more pronounced in patients with Q wave MI than in patients with non-Q wave MIs. Relating the signals of depolarization and repolarization phases improves the detection of healed MI. Repolarization abnormalities are common in healed MI and thus should not always be interpreted as present ongoing ischemia.


Figures

Figure 1
Figure 1
(A) Sensor arrangement and positioning of the cardiomagnetometer with 33 recording locations in relation to the thorax. The device was placed anteriorly with the center of the device 15 cm caudally from the jugular notch and 5 cm left of the midsternal line. (B) In the magnetic field map, the location and orientation of the steepest spatial change in the signal, the peak gradient, is indicated by an arrow. Solid lines indicate positive values and magnetic flux toward the chest and dotted lines indicate negative values and flux out of the chest. Orientation of the magnetic field was measured as the angle between direction of the peak gradient and horizontal x‐axis.
Figure 2
Figure 2
(a + b) Illustration of the calculation of QRS, ST‐segment, T wave, and ST‐T wave integrals, and QRS‐ST‐T discordance in each MCG channel. QRS integral was calculated as the time integral from the QRS onset to QRS offset. QRS area was calculated as the sum of absolute values of Q, R, and S wave areas. The ST‐segment, T wave, and ST‐T wave integrals were obtained as the corresponding time integrals. (a) If the main QRS deflection and the ST‐T wave were of same polarity, the ST‐T wave integral was subtracted from the QRS area when calculating the QRS‐ST‐T discordance. The QRS‐ST discordance and QRS‐T discordance were calculated in an analogous manner. (b) If the main QRS deflection and the ST‐T wave were of opposite polarity, the latter was multiplied by −1 when calculating the QRS‐ST‐T discordance. The QRS‐ST discordance and QRS‐T discordance were calculated in an analogous manner.
Figure 3
Figure 3
The group mean QRS integral and ST‐T wave integral MFMs. From top to bottom: the whole myocardial infarction patient group (MI), the Q wave myocardial infarction subgroup (QMI), the non‐Q wave myocardial infarction subgroup (NQMI), and the healthy controls (controls). The QRS integral maps of all patient groups resemble the map of the controls. On the contrary to QRS maps, the ST‐T wave integral maps show much more variation in between all the MI groups and the controls. The step between two isocontour lines is 100 pT. Positive values are denoted by solid lines, negative values by dotted lines, and zero field line by dashed line.
Figure 4
Figure 4
QRS integral and ST‐T wave integral departure maps. From top to bottom: the whole myocardial infarction patient group (MI), the Q wave myocardial infarction subgroup (QMI), and the non‐Q wave myocardial infarction subgroup (NQMI). In the QRS integral departure maps the MI groups had larger positive values over the inferior part and smaller negative values over the superior part of the mapping region than the controls. In contrast, in the ST‐T wave integral departure maps the MI groups had larger smaller negative values over the inferior part and larger positive values over the superior part of the mapping region than the controls. The step between two isocontour lines is 0.25. Positive values are denoted by solid lines, negative values by dotted lines, and zero line by dashed line.

Similar articles

Cited by

References

    1. Bertrand ME, Simoons ML, Fox KAA, et al Management of acute coronary syndromes in patients presenting without persistent ST‐segment elevation. Eur Heart J 2002;23:1809–1840. - PubMed
    1. Siltanen P. Magnetocardiography In MacFarlane P. (ed.): Comprehensive Electrocardiology, Vol. II New York , Pergamon Press, 1989, pp. 1408–1438.
    1. Nenonen J, Montonen J, Mäkijärvi M. Principles of magnetocardiographic mapping In Shenasa M, Borgreffe M, Breithardt G. (eds.): Cardiac Mapping, 2nd Edition Mount Kisco , NY , Futura Publishing Co., 2002, pp. 119–130.
    1. Hailer B, Chaikovsky I, Auth‐Eisernitz S, et al Magnetocardiography in coronary artery disease with a new system in an unshielded setting. Clin Cardiol 2003;26:465–471. - PMC - PubMed
    1. Brockmeier K, Schmitz L, Chavez JJB, et al Magnetocardiography and 32‐lead potential mapping: Repolarization in normal subjects during pharmacologically induced stress. J Cardiovasc Electrophysiol 1997;8:615–626. - PubMed