

Non-differential measurement error does not always bias diagnostic likelihood ratios towards the null
- PMID: 16846512
- PMCID: PMC1550225
- DOI: 10.1186/1742-7622-3-7
Non-differential measurement error does not always bias diagnostic likelihood ratios towards the null
Abstract
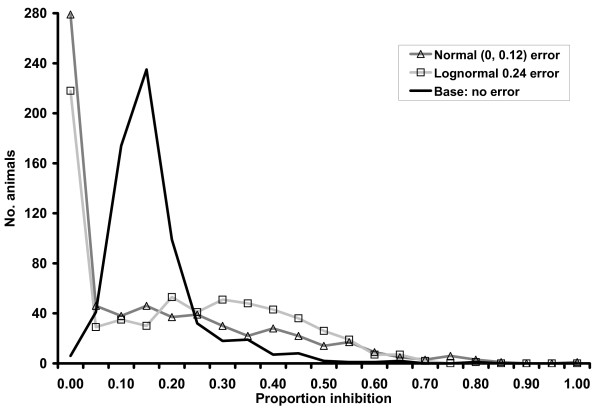
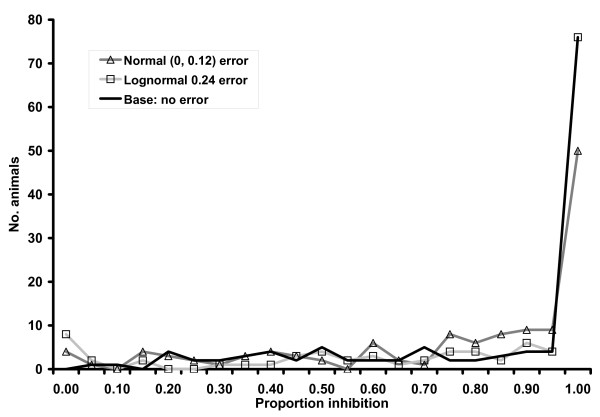
Diagnostic test evaluations are susceptible to random and systematic error. Simulated non-differential random error for six different error distributions was evaluated for its effect on measures of diagnostic accuracy for a brucellosis competitive ELISA. Test results were divided into four categories: < 0.25, 0.25-0.349, 0.35-0.499, and > or = 0.50 proportions inhibition for calculation of likelihood ratios and diagnostic odds ratios. Larger variance components of the error structure resulted in larger accuracy attenuations as measured by the area under the receiver-operating characteristic curve and systematic components appeared to cause little bias. Added error caused point estimates of likelihood ratios to be biased towards the null value (1.0) for all categories except 0.25-0.349. Results for the 0.35-0.499 category also extended beyond the null value for some error structures. Diagnostic odds ratios were consistently biased towards the null when the < 0.25 category was considered the reference level. Non-differential measurement error can lead to biased results in the quantitative evaluation of ELISA and the direction is not always towards the null value.
Figures
References
-
- Szklo M, Nieto FJ. Epidemiology : beyond the basics. Gaithersburg, Md: Aspen; 2000. pp. 125–126.
-
- Rothman KJ. Epidemiology : an introduction. New York, N.Y.: Oxford University Press; 2002. pp. 94–95.
-
- Webster's new millennium dictionary ofEnglish Preview edn. Long Beach, CA: Lexicon Publishing Group; 2005. http://dictionary.reference.com/search?q=systematic%20error 3-16-06.
LinkOut - more resources
Full Text Sources
