. 2006 Aug 22;273(1597):1999-2007.
doi: 10.1098/rspb.2006.3505.

Demographic structure and pathogen dynamics on the network of livestock movements in Great Britain

Affiliations

Demographic structure and pathogen dynamics on the network of livestock movements in Great Britain

R R Kao et al. Proc Biol Sci. .

Abstract

Using a novel interpretation of dynamic networks, we analyse the network of livestock movements in Great Britain in order to determine the risk of a large epidemic of foot-and-mouth disease (FMD). This network is exceptionally well characterized, as there are legal requirements that the date, source, destination and number of animals be recorded and held on central databases. We identify a percolation threshold in the structure of the livestock network, indicating that, while there is little possibility of a national epidemic of FMD in winter when the catastrophic 2001 epidemic began, there remains a risk in late summer or early autumn. These predictions are corroborated by a non-parametric simulation in which the movements of livestock in 2003 and 2004 are replayed as they occurred. Despite the risk, we show that the network displays small-world properties which can be exploited to target surveillance and control and drastically reduce this risk.


Figures

Figure 1
Figure 1
Comparison of giant strong component size over four-week periods from January 2003 to November 2004, with epidemic simulations. (a) GSCC size (filled diamonds) compared to FMD epidemic (open diamonds) for sheep movements only. Changes in GSCC size (∼11.0×) and epidemic size (∼13.9×) between June 2003 and September 2003 are similar (vis-a-vis change in number of movements of 3.9× (see figure A5 in the electronic supplementary material). (b) Giant strongly connected component (filled diamonds), giant weakly connected component (open diamonds) and difference between them (dashed line) in sheep movements. (c) GSCC size (filled diamonds) compared to FMD epidemic (open diamonds) for all livestock movements (cattle, pigs and sheep).
Figure 2
Figure 2
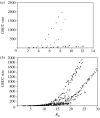
The growth of the giant strongly connected component (GSCC) for sheep and cattle movements. (a) Growth of the GSCC for sheep movements as a function of R0. Shown are sizes for infectious period of 28 days starting from 19 May 2004 (filled diamonds), infectious period of 28 days starting from 5 November 2003 (open diamonds), infectious period of 7 days starting from 19 May 2004 (filled squares) and infectious period of 7 days starting from 5 November 2003 (open squares). Probabilities of transmission in all four cases range from 0.1 per batch movement to 1.0 per batch movement. (b) Establishing ergodicity: figure as in (a) but infectious periods are varied in the same fashion for farms and markets. The R0 values are generated by choosing different combinations of infectious period and probability of transmission per link. In all cases, similar R0 values produce similar GSCC sizes when comparing within four-week periods, but different sizes when comparing between them. Above R0crit the behaviour can be described by a power law, nGSCC(R0R0crit)ϵ where nGSCC is the size of the GSCC. From 19 May 2004 (filled diamonds), R0crit=4.8, ϵ=4.1, R2=0.91 on a log–log plot and from 5 November 2003 (open diamonds), R0crit=12.7, ϵ=5.1, R2=0.93 on a log–log plot. The value of R0crit is chosen by identifying the local maximum in the R2 value, and power law exponent is chosen by linear regression above that value.
Figure 3
Figure 3
Geographical distribution of strongly connected components (by colour) in sheep movements from 19 May 2004, assuming all movements are infectious, showing all components of size greater than four, as the length of the infectious period increases from 10 to 20 days. Component colours are only conserved across the three periods if the component is conserved; e.g. if the ‘blue’ component is absorbed by the ‘red’ component, then blue may be re-used.
Figure 4
Figure 4
(a) Distribution of number of IPs for epidemics seeded in Northumberland with 10 sheep farms, simulating early conditions during the 2001 epidemic, for movement of sheep only (open diamonds) and allowing for movements of all livestock (filled diamonds). In both cases, random local transmission up to 10 km is allowed. Two hundred simulations of epidemics are run for 21 days, assuming transmission parameters for the 2001 epidemic, but starting in September 2004, when sheep movements are at their highest. (b) Risk map for all of GB allowing for all movements of livestock, showing average number of IPs per simulated epidemic in 100 km2 grid squares. Maximum density of IPs is 0.25 per 100 km2 (red). (c) As in (b), but only allowing for movement of sheep.
Figure 5
Figure 5
Community structures (by colour). Shown are (a) the six largest communities using all sheep movements in the four-week period starting from 19 May 2004, and (b) the result of applying the algorithm to the largest of the communities, to identify subcommunities. In both cases, community structure is highly regional though with some community members widely distributed.
Figure 6
Figure 6
The distributions (cumulative and non-cumulative) of community sizes for all 24 four-week periods starting from 1 January 2003. The distribution of sizes is consistent across all periods, suggesting that local patterns of movement remain similar, even though the size of the GSCC changes dramatically over the course of the year (figure 1).
Figure 7
Figure 7
Targeted control of disease transmission on the sheep movement network. Comparison of GSCC size with no removal of links (formula image) to GSCC size under the effect of random removal of links (filled diamonds) and targeted removal of farm-to-market links (open diamonds), where the farm has previously bought from a market. Data from four-week period starting from 19 May 2004, total links=24 589, of which 1539 are the targeted farm-to-market following market–farm links.

Similar articles

Cited by

References

    1. Albert R, Jeong H, Barabasi A.L. Error and attack tolerance of complex networks. Nature. 2000;406:378–382. 10.1038/35019019 - DOI - PubMed
    1. Alexandersen S, Kitching R.P, Mansley L.M, Donaldson A.I. Clinical and laboratory investigations of five outbreaks of foot-and-mouth disease during the 2001 epidemic in the United Kingdom. Vet. Rec. 2003a;152:489–496. - PubMed
    1. Alexandersen S, Quan M, Murphy C, Zhang Z. Studies of quantitative parameters of virus excretion and transmission in pigs and cattle experimentally infected with foot-and-mouth disease virus. J. Comp. Pathol. 2003b;129:268–282. 10.1016/S0021-9975(03)00045-8 - DOI - PubMed
    1. Anderson I. Foot & Mouth Disease 2001: Lessons to be Learned Inquiry Report. The Stationary Office; London, UK: 2002.
    1. Anderson R.M, May R.M. Infectious diseases of humans: dynamics and control. Oxford University Press; Oxford, UK: 1991.

Publication types