. 2006 Aug;128(2):153-69.
doi: 10.1085/jgp.200609557. Epub 2006 Jul 17.

Visual cycle: Dependence of retinol production and removal on photoproduct decay and cell morphology

Affiliations

Visual cycle: Dependence of retinol production and removal on photoproduct decay and cell morphology

Petri Ala-Laurila et al. J Gen Physiol. 2006 Aug.

Abstract

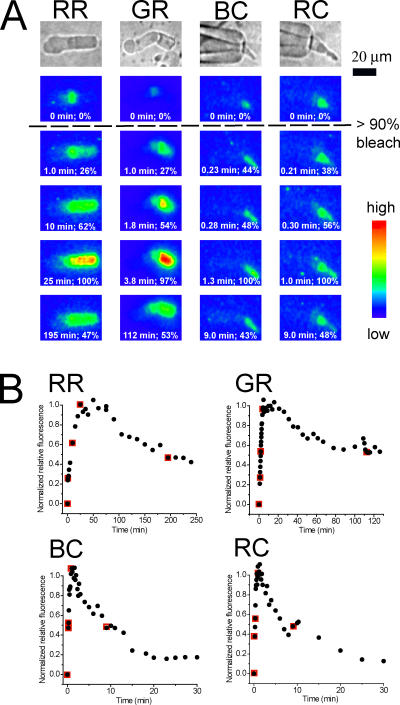
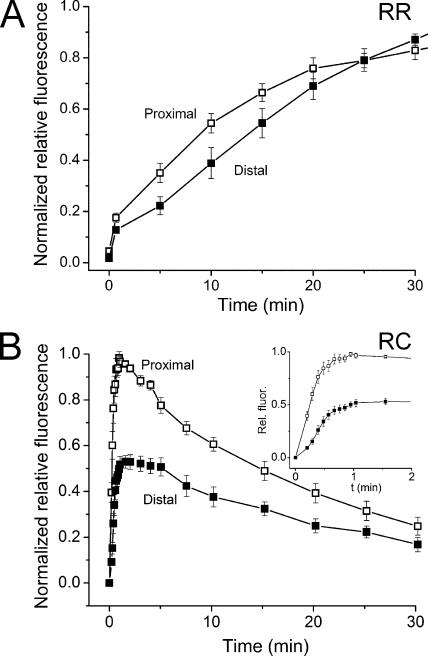
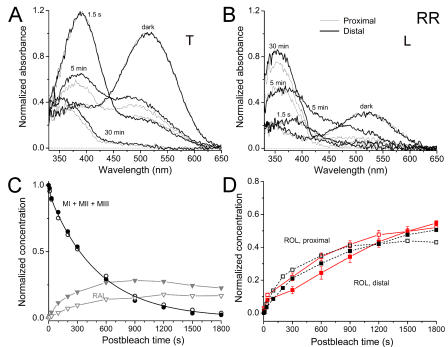
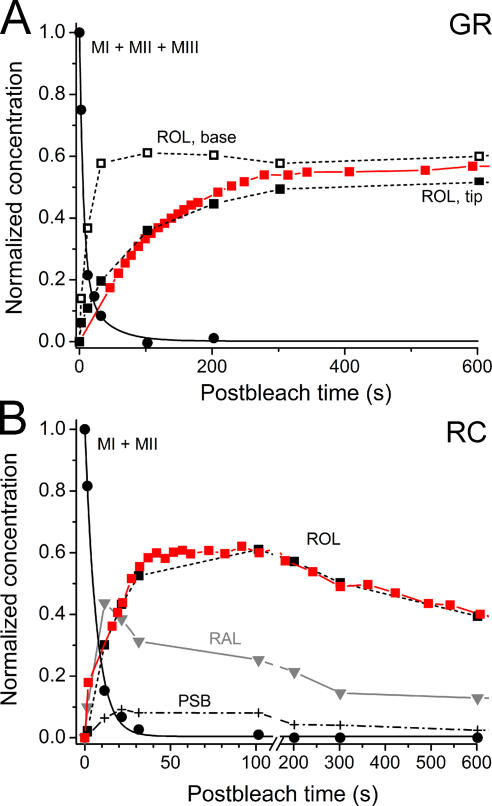
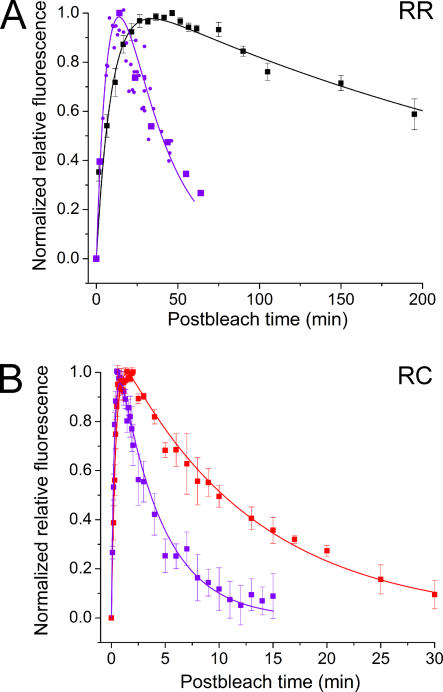
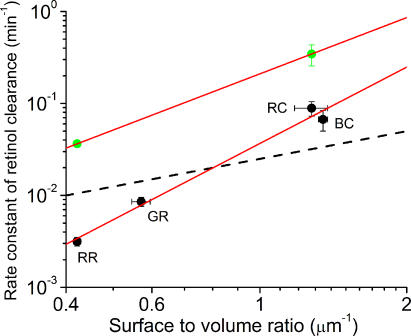
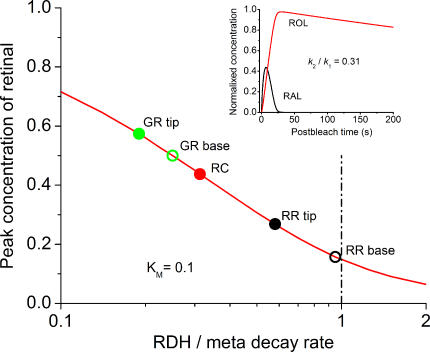
The visual cycle is a chain of biochemical reactions that regenerate visual pigment following exposure to light. Initial steps, the liberation of all-trans retinal and its reduction to all-trans retinol by retinol dehydrogenase (RDH), take place in photoreceptors. We performed comparative microspectrophotometric and microfluorometric measurements on a variety of rod and cone photoreceptors isolated from salamander retinae to correlate the rates of photoproduct decay and retinol production. Metapigment decay rate was spatially uniform within outer segments and 50-70 times faster in the cells that contained cone-type pigment (SWS2 and M/LWS) compared to cells with rod-type pigment (RH1). Retinol production rate was strongly position dependent, fastest at the base of outer segments. Retinol production rate was 10-40 times faster in cones with cone pigments (SWS2 and M/LWS) than in the basal OS of rods containing rod pigment (RH1). Production rate was approximately five times faster in rods containing cone pigment (SWS2) than the rate in basal OS of rods containing the rod pigment (RH1). We show that retinol production is defined either by metapigment decay rate or RDH reaction rate, depending on cell type or outer segment region, whereas retinol removal is defined by the surface-to-volume ratio of the outer segment and the availability of retinoid binding protein (IRBP). The more rapid rates of retinol production in cones compared to rods are consistent with the more rapid operation of the visual cycle in these cells.


Figures

Figure 1.
Figure 1.
Bright field and pseudo-color fluorescence images before and after bleaching the visual pigment of salamander rod and cone photoreceptor cells. (A) The top row shows bright field images of single photoreceptor cells: (from left to right) red rod (RR), green rod (GR), blue-sensitive cone (BC), and red-sensitive cone (RC). The five pseudo-color images shown below each bright field image were measured before (top) and at different times after exposure to a bright light (at time = 0) that bleached >90% of the visual pigment. The time at which the image was taken and the normalized relative fluorescence (%) averaged over the whole OS are shown at the bottom of each fluorescence image. (B) Plots of the time course of the average normalized relative fluorescence intensity for each of the cells shown in A. The five data points highlighted by red squares correspond to the fluorescence images shown in A. Data points from fluorescence images not illustrated in A are indicated by black circles.
Figure 2.
Figure 2.
Time course of the average normalized fluorescence change (mean ± SEM) in two different outer segment regions of intact isolated salamander red rods (n = 7, A) and red-sensitive cones (n = 6, B): proximal OS (□), distal OS (▪). (B, inset) Same data as in main panel plotted on expanded time scale. Data are normalized relative to the peak value.
Figure 3.
Figure 3.
Photolysis of salamander red rod visual pigment at the tip and base of the ROS as assessed by microspectrophotometry. (A) Absorbance spectra recorded from the tip (bold lines) and base (thin lines) of salamander red rod (RR) outer segments in darkness, immediately (1.5 s) and at various times after exposure to bleaching light (1500-ms flash, 525-nm). Recordings at 10, 30, 100, 200 s, and 10, 15, 20, and 25 min are omitted from the figure for clarity. Measurements made at T-polarization, average of six cells. (B) Same as A, L-polarization. The spectra are normalized to unity at the T spectral maximum of the bleached pigment at each location. (C) Time courses of concentrations of the sum of metapigments (circles) and retinal (triangles). OS tip, closed symbols. OS base, open symbols. Smooth curve through circles shows a bi-exponential approximation of meta decay based on pooled tip and base data (see Table II for fit parameters). (D) Time courses of retinol production at the ROS base (open squares) and tip (closed squares). Black curves, MSP. Red curves, microfluorometry. Fluorescence data are scaled (by the same factor for base and tip) for best visual match to the MSP data. Error bars represent SEM.
Figure 4.
Figure 4.
Time course of metapigment decay and retinal and retinol concentration changes in salamander green rods (GR) and red-sensitive cones (RC). Filled circles fitted by black continuous line in A and B illustrate metapigment decay. Parameters of the fits are given in Table II. (A) Black dashed line through black squares, time course of retinol (ROL) as assessed with MSP (filled squares, tip of the OS; empty squares, base). Data on meta decay are average of three isolated OSs and two intact cells; retinol time course deduced from MSP data is based on two intact cells. The retinol time course averaged over entire OS as assessed by microfluorometry (average of seven cells) is shown by red squares. The time courses of retinal and PSB are omitted for clarity. (B) Gray line through inverted triangles shows RAL. Dot-dashed line through crosses, PSB. Average of seven cells. Red line through filled red squares, average time course of retinol (ROL) as assessed with microfluorometry and scaled for the best match to ROL data assessed by MSP. Error bars omitted for clarity.
Figure 5.
Figure 5.
Comparisons of the time course of retinol fluorescence changes measured in different salamander rod and cone outer segments after bleaching the visual pigment. In all cases, >90% of pigment was bleached by a step of light at time = 0. (A) Comparison of the time course of average post-bleach fluorescence production and clearance (mean ± SEM) of red-sensitive cones (RC, red squares, n = 4) and red rods (RR, black squares, n = 7). The inset in A compares the time course of retinol fluorescence changes over a longer time period to demonstrate the differences in the clearance rates of retinol between rod- and cone-type photoreceptors. (B) Comparison of the kinetics of fluorescence production in salamander blue-sensitive cones (BC, blue squares, n = 3) and green rods (GR, green squares, n = 5), which contain identical visual pigments (mean ± SEM). Inset in B compares the difference in the kinetics of the rising phase of fluorescence of blue-sensitive cones and green rods. Continuous curves in A and B are fitted to the data according to Eq. 4. The time constants (τ1, τ2) of the best-fitting bi-exponential models shown in A and B are listed in Table I. (C) Comparison of the rates of metaproduct decay (=retinal production) in various types of photoreceptors. The data are fitted with either single-exponential (RC) or bi-exponential function (RR and GR). Parameters of the fits are given in Table II.
Figure 6.
Figure 6.
The effect of presence and absence of 100 μm IRBP on post-bleach production and clearance of retinol in rod and cone outer segments. (A) Comparison of time course of fluorescence changes in salamander red rod OSs in normal Ringer (RR, black squares, n = 7) and in the presence of IRBP (violet symbols). Small violet circles comprise recordings from a single cell; violet squares represent average data (n = 5, replotted from Tsina et al. 2004). (B) Comparison of the time course of normalized average fluorescence in salamander red-sensitive cone OSs in normal Ringer (RC, red squares, n = 4) and in the presence of IRBP (violet squares, n = 6). Continuous lines are fitted according to Eq. 4. (See Table I for the time constants). Error bars: SEM.
Figure 7.
Figure 7.
The dependence of the relative rates of retinol clearance on the surface to volume ratio of rod and cone photoreceptor outer segments. The clearance rate of retinol (mean ± SEM) of each cell type is plotted against the mean estimate of surface to volume ratio of each photoreceptor type (numerical values shown in Table I). The data are plotted on logarithmic scale. Black symbols correspond to measurements in normal Ringer (from left to right): salamander red rods (RR, n = 7), salamander green rods (GR, n = 5), salamander red-sensitive cones (RC, n = 4), and salamander blue-sensitive cones (BC, n = 3). Green symbols correspond to measurements in the presence of IRBP (100 μM) (from left to right): salamander red rods (n = 6) and salamander red-sensitive cones (n = 6). The red continuous lines show the best-fitting power functions to measurements in Ringer and in the presence of IRBP. Dashed black line shows the best fitting line that assumes linear dependence between the clearance rate and the S/V ratio.
Figure 8.
Figure 8.
Assessing relative rates of retinal and retinol generation from the height of the retinal peak. The red curve in the main panel shows the peak retinal concentration as a function of k 2/k 1 ratio calculated based on the model described in the text and assuming KM = 0.1. Dots correspond to peak retinal concentrations obtained by the MSP for various cell types. Inset, an example of RAL and ROL time courses calculated for the RAL peak 0.44 and k 1 = 0.15 s−1, as measured with MSP in RC. Height of the RAL peak corresponds to the k 2/k 1 ratio of 0.31.

Comment in

References

    1. Azuma, K., M. Azuma, and W. Sickel. 1977. Regeneration of rhodopsin in frog outer segments. J. Physiol. 271:747–759. - PMC - PubMed
    1. Baylor, D.A., T.D. Lamb, and K.W. Yau. 1979. The membrane current of single rod outer segments. J. Physiol. 288:589–611. - PMC - PubMed
    1. Blaurock, A.E., and M.H. Wilkins. 1969. Structure of frog photoreceptor membranes. Nature. 223:906–909. - PubMed
    1. Chen, C., E. Tsina, M.C. Cornwall, R.K. Crouch, S. Vijayaraghavan, and Y. Koutalos. 2005. Reduction of all-trans retinal to all-trans retinol in the outer segments of frog and mouse rod photoreceptors. Biophys. J. 88:2278–2287. - PMC - PubMed
    1. Cocozza, J.D., and S.E. Ostroy. 1987. Factors affecting the regeneration of rhodopsin in the isolated amphibian retina. Vision Res. 27:1085–1091. - PubMed

Publication types

MeSH terms