. 2006 Jul 17;174(2):277-88.
doi: 10.1083/jcb.200510062.

An inhibitory role for FAK in regulating proliferation: a link between limited adhesion and RhoA-ROCK signaling

Affiliations

An inhibitory role for FAK in regulating proliferation: a link between limited adhesion and RhoA-ROCK signaling

Dana M Pirone et al. J Cell Biol. .

Abstract

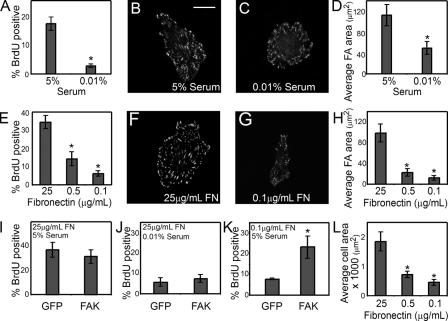
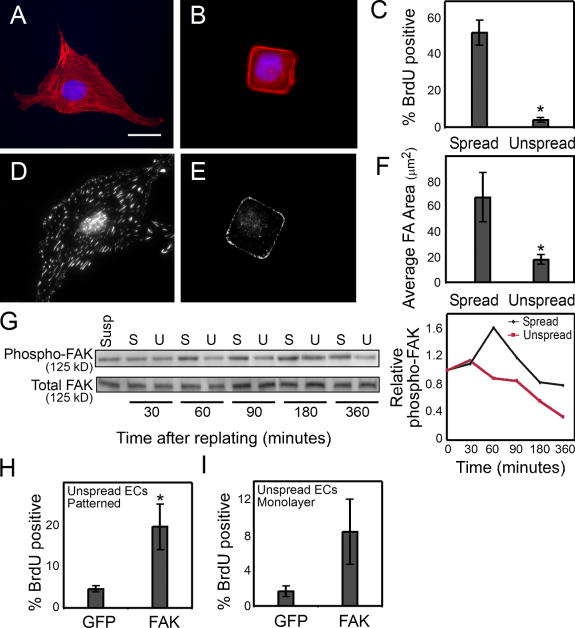
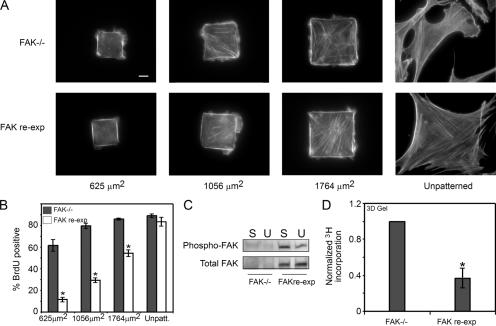
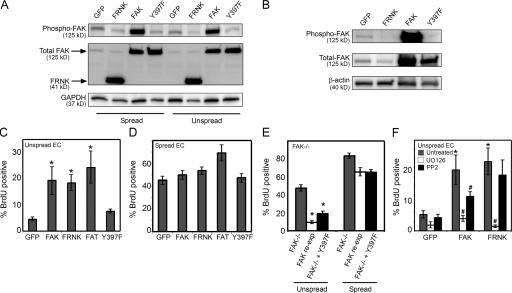
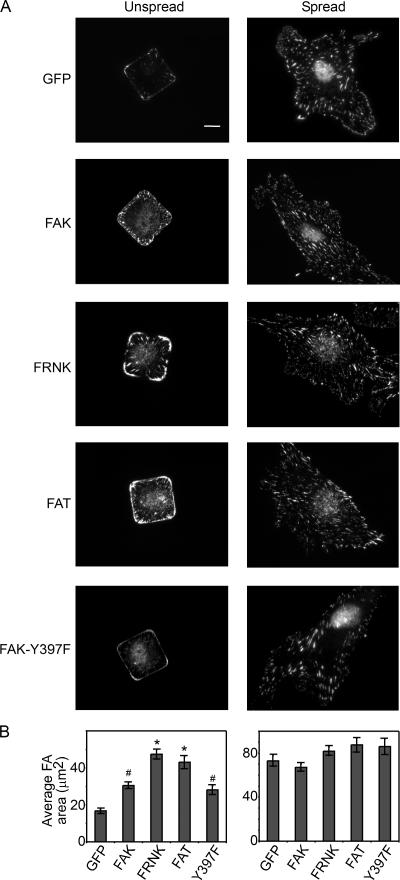
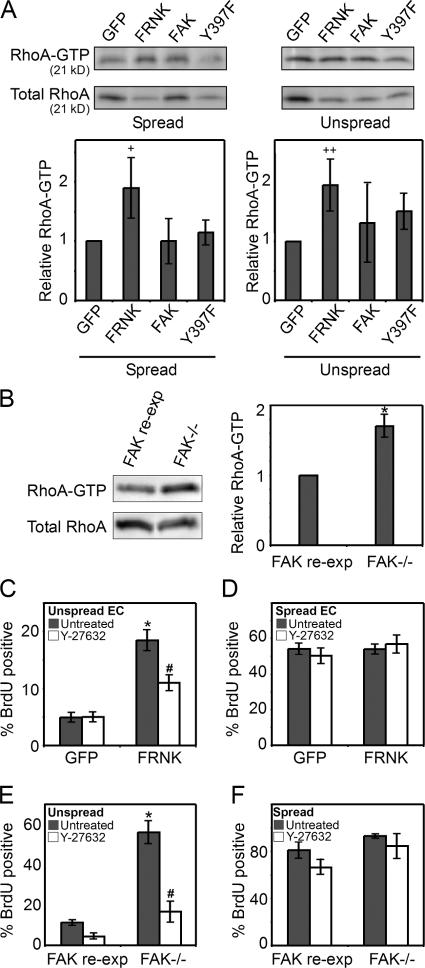
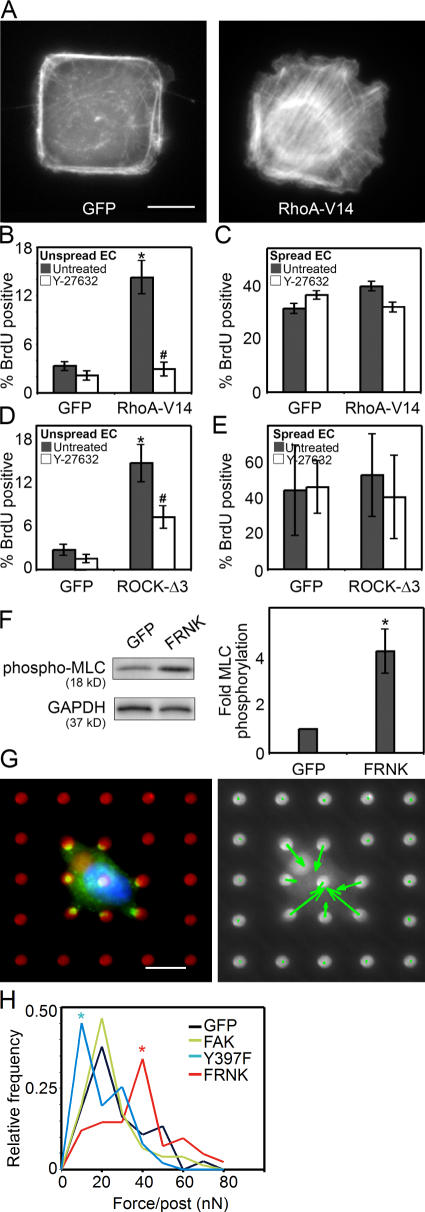
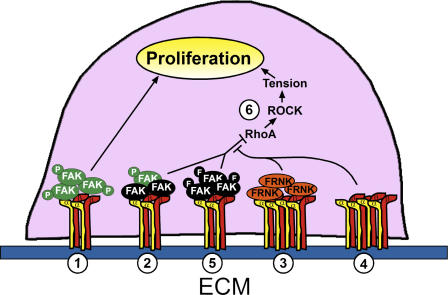
Focal adhesion kinase (FAK) transduces cell adhesion to the extracellular matrix into proliferative signals. We show that FAK overexpression induced proliferation in endothelial cells, which are normally growth arrested by limited adhesion. Interestingly, displacement of FAK from adhesions by using a FAK-/- cell line or by expressing the C-terminal fragment FRNK also caused an escape of adhesion-regulated growth arrest, suggesting dual positive and negative roles for FAK in growth regulation. Expressing kinase-dead FAK-Y397F in FAK-/- cells prevented uncontrolled growth, demonstrating the antiproliferative function of inactive FAK. Unlike FAK overexpression-induced growth, loss of growth control in FAK-/- or FRNK-expressing cells increased RhoA activity, cytoskeletal tension, and focal adhesion formation. ROCK inhibition rescued adhesion-dependent growth control in these cells, and expression of constitutively active RhoA or ROCK dysregulated growth. These findings demonstrate the ability of FAK to suppress and promote growth, and underscore the importance of multiple mechanisms, even from one molecule, to control cell proliferation.


Figures

Figure 1.
Figure 1.
FAK regulates adhesion-mediated proliferation. (A–D) Graph of the percentage of ECs in S phase, measured by the incorporation of BrdU (A), immunofluorescence images of vinculin (B and C), and a graph of the average focal adhesion area per cell (D) in cells cultured for 24 h in 5 or 0.01% serum, on surfaces coated with 25 μg/ml fibronectin. (E–H) Graph of the percentage of ECs in S phase (E), immunofluorescence images of vinculin (F and G), and graph of average focal adhesion area per cell (H) in cells cultured in 5% serum on surfaces coated with 25, 0.5, or 0.1 μg/ml fibronectin. (I–K) Graph of the percentage of GFP- or FAK-overexpressing ECs that enter S phase when cultured on 25 μg/ml fibronectin-coated surfaces in 5% serum (I), on 25 μg/ml fibronectin-coated surfaces in 0.01% serum (J), or on 0.1 μg/ml fibronectin-coated surfaces in 5% serum (K). (L) Average area of cells when cultured in 5% serum and on surfaces coated with 25, 0.5, or 0.1 μg/ml fibronectin. Data is expressed ± SEM for three independent experiments. *, P < 0.05. Bar, 20 μm.
Figure 2.
Figure 2.
FAK regulates shape-mediated proliferation. (A and B) F-actin (red) and DAPI (blue) stain of ECs cultured on surfaces uniformly coated with 25 μg/ml fibronectin (Spread; A) or onto 625-μm2 islands of fibronectin (Unspread; B). (C) Graph of the percentage of spread versus unspread cells in S phase measured by the incorporation of BrdU. (D and E) Immunofluorescence images of vinculin in cells cultured on surfaces uniformly coated with 25 μg/ml fibronectin (D) or onto 625-μm2 islands of fibronectin (E). (F) Graph of the average focal adhesion area per spread versus unspread cell. (G) Western blot of phospho–Y397-FAK and total FAK in spread (S) versus unspread (U) cells at 30, 60, 90, 180, and 360 min after replating, and a graph showing phospho-FAK normalized to total FAK. (H and I) Graph of the percentage of GFP- or FAK-overexpressing ECs that enter S phase when cultured on 625-μm2 islands of fibronectin (H) or in a monolayer (I). Data is expressed ± SEM for three independent experiments. *, P < 0.05. Bar, 20 μm.
Figure 3.
Figure 3.
FAK has a growth inhibitory role. (A and B) F-actin stain (A) and graph of the percentage of cells in S phase (B) for FAK−/− cells and FAK-reexpressing cells cultured on different-sized islands of fibronectin. (C) Western blot of phospho–Y397-FAK and total FAK in FAK−/− and FAK-reexpressing cells in spread (substrates coated with 25 μg/ml fibronectin; S) or unspread (substrates patterned with 625-μm2 islands of fibronectin; U) conditions. (D) Graph of the percentage of FAK−/− and FAK-reexpressing cells in S phase when cultured in a 3D collagen gel. All data is expressed as ± SEM for three independent experiments. *, P < 0.05 between FAK−/− or FAK-reexpressing cells. Bar, 10 μm.
Figure 4.
Figure 4.
FRNK stimulates proliferation in low adhesive contexts. (A) Western blots of GFP-, FAK-, FRNK-, or FAK-Y397F-overexpressing ECs in spread (substrates coated with 25 μg/ml fibronectin) or unspread (substrates patterned with 625-μm2 islands of fibronectin) conditions and probed for phospho–Y397-FAK, total FAK, or GAPDH. (B) Western blot of phospho–Y397-FAK and total FAK in the Triton X-100–insoluble fraction of unspread ECs expressing GFP (control), FRNK, FAK, or FAK-Y397F. β–actin is shown as a loading control. (C and D) Graph of the percentage of GFP-, FAK-, FRNK-, FAT-, or FAK-Y397F–overexpressing ECs entering S phase when cultured on 625-μm2 islands of fibronectin (C) or on substrates coated with 25 μg/ml fibronectin (D). (E) Graph of the percentage of FAK−/− cells, FAK-reexpressing cells, and FAK−/− cells overexpressing FAK-Y397F in S phase when cultured in spread or unspread conditions. (F) Graph of the percentage of GFP-, FAK-, or FRNK-overexpressing ECs entering S phase when cultured on 625-μm2 islands of fibronectin and treated with either 10 μM UO126 or 1 μM PP2. All data is expressed as ± SEM for three independent experiments. *, P < 0.05 with GFP control or FAK−/− cells. #, P < 0.05 with untreated control.
Figure 5.
Figure 5.
FRNK and FAT induce focal adhesion growth in unspread cells. (A) Immunofluorescence images of vinculin in GFP-, FAK-, FRNK-, FAT-, or FAK-Y397F–overexpressing ECs cultured for 24 h onto 625-μm2 islands of fibronectin (Unspread) or surfaces uniformly coated with 25 μg/ml fibronectin (Spread). Graph of the average focal adhesion area of GFP-, FAK-, FRNK-, FAT-, or FAK-Y397F–expressing ECs when cultured in spread versus unspread conditions (B). Data is expressed ± SEM. Approximately 150 cells were analyzed in each condition; *, P < 0.05 with GFP control; #, P < 0.05 as compared with FRNK or FAT conditions. Bar, 10 μm.
Figure 6.
Figure 6.
FRNK expression increases RhoA activity. (A) RhoA-GTP and total RhoA levels in GFP-, FRNK-, FAK-, or FAK-Y397F–expressing ECs. (B) RhoA-GTP and total RhoA levels in FAK−/− or FAK-reexpressing cells. (C and D) Graph of the percentage of GFP- or FRNK-overexpressing ECs that enter S phase when cultured on 625-μm2 islands of fibronectin (C) or on surfaces coated with 25 μg/ml fibronectin (D) and either untreated or treated with 50 μM Y-27632. (E and F) Graph of the percentage of FAK−/− or FAK-reexpressing cells that enter S phase when cultured on 625-μm2 islands of fibronectin (E), or on surfaces coated with 25 μg/ml fibronectin (F) and either untreated or treated with 50 μM Y-27632. Data is expressed ± SEM for three independent experiments. +, P < 0.08 compared with control; ++, P < 0.06 compared with control; *, P < 0.05 between FRNK-overexpressing condition versus GFP control, or FAK−/− versus FAK-reexpressing cells; #, P < 0.05 between FRNK-induced proliferation or FAK−/− proliferation in untreated versus drug-treated samples.
Figure 7.
Figure 7.
RhoA-mediated contractility rescues proliferation in unspread cells. (A) F-actin stain of GFP-, or RhoA-V14–overexpressing ECs cultured on 625-μm2 islands of fibronectin. (B and C) Graph of the percentage of GFP- or RhoA-V14–overexpressing ECs that enter S phase when cultured on 625-μm2 islands of fibronectin (B), or on surfaces uniformly coated with 25 μg/ml fibronectin (C) and either untreated or treated with 50 μM Y-27632. (D and E) Graph of the percentage of GFP- or ROCK-Δ3–overexpressing ECs that enter S phase when cultured on 625-μm2 islands of fibronectin (D), or on surfaces that were uniformly coated with 25 μg/ml fibronectin (E), and either untreated or treated with 50 μM Y-27632. (F) Western blot and graph of phosphorylated myosin light chain in GFP- versus FRNK-expressing ECs, normalized to GAPDH. (G) A representative GFP-expressing EC cultured on the mPAD force sensors (red, fibronectin; green, GFP; blue, nucleus) and accompanying vector plot (green arrows indicate magnitude and the direction of force exerted on each underlying post). (H) Distribution plot of the magnitude of traction forces exerted by GFP-, FAK-, FRNK-, or FAK-Y397F–expressing ECs on mPADs. Data is expressed ± SEM for at least three independent experiments for proliferation and myosin phosphorylation data. For proliferation graphs, * denotes P < 0.05 between RhoA-V14 or ROCK-Δ3 versus GFP control and # denotes P < 0.05 between RhoA-V14 or ROCK-Δ3–induced proliferation in untreated versus drug-treated samples. For force distribution plot, * denotes P < 0.05 between adenovirus condition as compared with GFP control. Bars, 10 μm.
Figure 8.
Figure 8.
Model for FAK modulation of adhesion-regulated proliferation. (1) In conditions that activate FAK (green FAK circles), such as high adhesive contexts or FAK overexpression, FAK plays a stimulatory role in proliferation. (2) Endogenous FAK in low adhesive contexts, including low cell spreading, low fibronectin density, and 3D gels, is largely inactive (black FAK circles) and inhibits proliferation. When inactive full-length FAK is displaced by FRNK or FAT (3), or is eliminated as in FAK−/− cells (4), RhoA is activated, leading to ROCK activation and the development of cytoskeletal tension, creating a condition that is permissive for proliferation even in low adhesive conditions. (5) The dominant–negative FAK-Y397F (black FAK circles with F) is sufficient to rescue the inhibitory function of FAK, but not its stimulatory role, in proliferation. Expression of constitutively active RhoA or ROCK (6) alone can induce proliferation in low adhesive contexts.

Similar articles

Cited by

References

    1. Amano, M., M. Ito, K. Kimura, Y. Fukata, K. Chihara, T. Nakano, Y. Matsuura, and K. Kaibuchi. 1996. Phosphorylation and activation of myosin by Rho-associated kinase (Rho-kinase). J. Biol. Chem. 271:20246–20249. - PubMed
    1. Angers-Loustau, A., J.F. Cote, A. Charest, D. Dowbenko, S. Spencer, L.A. Lasky, and M.L. Tremblay. 1999. Protein tyrosine phosphatase–PEST regulates focal adhesion disassembly, migration, and cytokinesis in fibroblasts. J. Cell Biol. 144:1019–1031. - PMC - PubMed
    1. Ayaki, M., K. Komatsu, M. Mukai, K. Murata, M. Kameyama, S. Ishiguro, J. Miyoshi, M. Tatsuta, and H. Nakamura. 2001. Reduced expression of focal adhesion kinase in liver metastases compared with matched primary human colorectal adenocarcinomas. Clin. Cancer Res. 7:3106–3112. - PubMed
    1. Balaban, N.Q., U.S. Schwarz, D. Riveline, P. Goichberg, G. Tzur, I. Sabanay, D. Mahalu, S. Safran, A. Bershadsky, L. Addadi, and B. Geiger. 2001. Force and focal adhesion assembly: a close relationship studied using elastic micropatterned substrates. Nat. Cell Biol. 3:466–472. - PubMed
    1. Bohmer, R.M., E. Scharf, and R.K. Assoian. 1996. Cytoskeletal integrity is required throughout the mitogen stimulation phase of the cell cycle and mediates the anchorage-dependent expression of cyclin D1. Mol. Biol. Cell. 7:101–111. - PMC - PubMed

Publication types

MeSH terms

Substances