. 2006 Aug;26(15):5569-79.
doi: 10.1128/MCB.00405-06.

Tissue-specific chromatin modifications at a multigene locus generate asymmetric transcriptional interactions

Affiliations

Tissue-specific chromatin modifications at a multigene locus generate asymmetric transcriptional interactions

Eung Jae Yoo et al. Mol Cell Biol. 2006 Aug.

Abstract

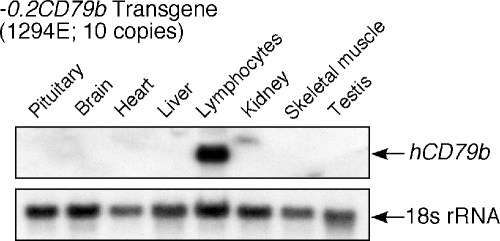
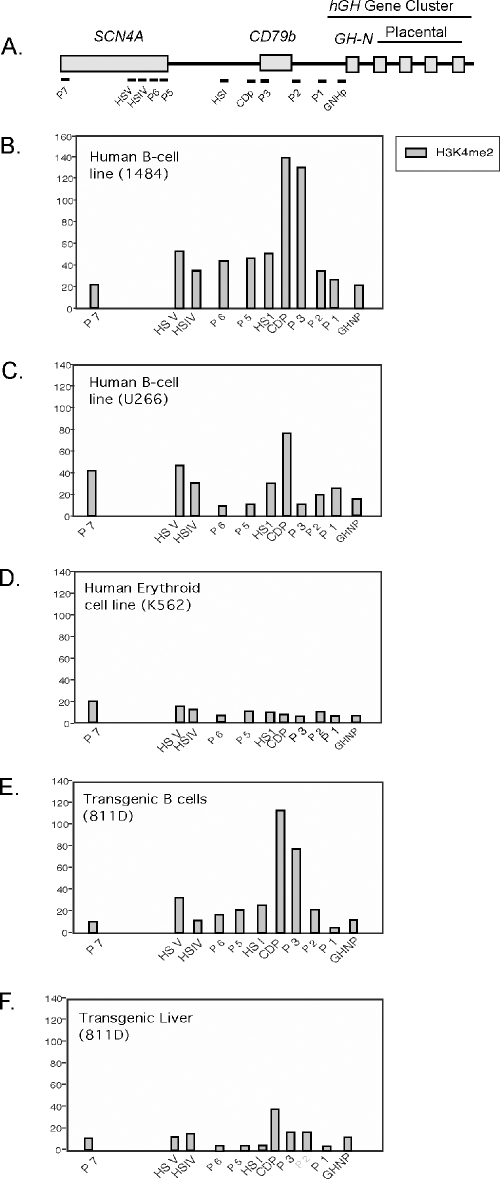
Random assortment within mammalian genomes juxtaposes genes with distinct expression profiles. This organization, along with the prevalence of long-range regulatory controls, generates a potential for aberrant transcriptional interactions. The human CD79b/GH locus contains six tightly linked genes with three mutually exclusive tissue specificities and interdigitated control elements. One consequence of this compact organization is that the pituitary cell-specific transcriptional events that activate hGH-N also trigger ectopic activation of CD79b. However, the B-cell-specific events that activate CD79b do not trigger reciprocal activation of hGH-N. Here we utilized DNase I hypersensitive site mapping, chromatin immunoprecipitation, and transgenic models to explore the basis for this asymmetric relationship. The results reveal tissue-specific patterns of chromatin structures and transcriptional controls at the CD79b/GH locus in B cells distinct from those in the pituitary gland and placenta. These three unique transcriptional environments suggest a set of corresponding gene expression pathways and transcriptional interactions that are likely to be found juxtaposed at multiple sites within the eukaryotic genome.


Figures

FIG. 1.
FIG. 1.
hCD79b/GH locus and expression of CD79b in human B-cell lines. A. The hCD79b/GH locus on human chromosome 17q22-24. Vertical arrows indicate the positions of DNase I HS previously identified in chromatin of pituitary somatotropes and placental STB. HSI and HSII are pituitary gland specific, and HSIV is placenta specific. The horizontal arrows indicate the direction of transcription from each gene. The corresponding tissue specificities are noted. B. CD79b expression in developmental-stage human B-cell lines. RNA samples from the K562 human erythroleukemia cell line and from a series of established human B-cell lines were analyzed by Northern blotting. The identity of each B-cell line and its reported stage of differentiation along the B-cell lineage is noted above the respective lanes. The membrane was hybridized with 32P-cDNA probes to human CD79b mRNA and to mouse ribosomal protein 32 (mRPL32) mRNA as a loading control. The expected positions of the two mRNA signals are noted to the left of the autoradiograph.
FIG. 2.
FIG. 2.
Identification of a B-cell-specific DNase I HS at the hCD79b/GH locus. A. Two DNase I HS are detected within and immediately 5′ of the CD79b gene; HSB1 is B cell specific. Chromatin samples from the B-cell lines were subjected to DNase I HS mapping. For the left panel, chromatin preparations from six human B-cell lines representing various developmental stages (697, REH, 25A, 9068, 1484, and 1621) were analyzed. The relative level of CD79b mRNA in each cell line, as determined from Northern blot analysis (Fig. 1 and data not shown), is indicated above the corresponding lanes (strong, ++; intermediate, +; low, +/−). The first lane contains a DNA size marker (M). The analyzed EcoRI fragment is 12.5 kb (marked by a black dot). Sub-bands generated by graded DNase I digestions (times of 0 s, 10 s, and 1 min) are indicated by the horizontal arrows to the right of the autoradiograph (HSB1 and HSa). The band at 8 kb was present irrespective of DNase I digestion (time 0) and was considered to be a cross-hybridizing band of unknown origin. For the right panel, DNase I HS mapping of chromatin from a human choriocarcinoma cell line (JEG3) and the erythroleukemia cell line (K562) were compared to a pre-B-cell line (Nalm6). HSB1 was only detectable in Nalm6 cells, whereas HSa was present in all three lines. The diagram below the blots summarizes the strategy and results of the HS mapping studies depicted in the blots. The relevant EcoRI restriction enzyme sites, the probe (Prb1; Table 2; filled box below the CD79b gene), fragment sizes, and positions of HSB1 and HSa, as well as pituitary cell-specific HSI and HSII for reference, are shown within the 12.5-kb EcoRI fragment. B. Three DNase I HS are detected in the remote 5′-flanking region of CD79b; HSB2 is B cell specific. Chromatin mapping and labeling of the autoradiograph are as described for panel A. The 23.1-kb EcoRI fragment (marked by a black dot) studied with probe Prb2 is located immediately 5′ to the fragments depicted in panel A. The DNase I sub-bands generated from this fragment are HSV, HSIII, and HSB2 (positions indicated at the right of each autoradiograph). The left panel shows DNase I mapping of the human B-cell lines; positions of HSV, HSIII, and HSB2 are indicated at the right. The right panel shows DNase I mapping of two nonlymphoid lines (JEG3 and K562) and a B-cell line (CA46). HSB2 was formed in the B-cell line but not in JEG3 or K562. The band below the 23.1-kb master band in panel B is a nonspecific, cross-hybridizing band. The diagram at the bottom summarizes the mapping experimental scheme and results as described in the legend to panel A. The hybridization probe (Prb2) is indicated by the filled rectangle. C. Localization of B-cell-specific HS in the hCD79b/GH locus. Arrows (open) above the map indicate B-cell-specific HS and the HSa identified in the current report. Arrows (closed) summarize HS identified in prior studies. HSI and HSII are specific to pituitary chromatin, HSIV is specific to placental chromatin, and HSIII and HSV are constitutive.
FIG. 3.
FIG. 3.
hCD79b mRNA levels in splenic lymphocytes of transgenic mice. A. Transgenes are depicted. The map of the CD79b gene and its 5′-flanking region indicates the positions of B-cell-specific HS (black arrows) and the two HS specific to the pituitary gland (HSI and HSII; white arrows) for reference. A CpG hypomethylated region of DNA specific to B cells is shown (stippled circle). The four CD79b transgenes are indicated on the map along with their respective sizes. The name of each of these transgenes corresponds to the length of the 5′-flanking region in each case. B. Quantitation of human versus mouse CD79b mRNAs. hCD79b mRNA and endogenous mCD79b mRNA were reverse transcribed (RT) coamplified from B cells purified from the spleens of the indicated transgenic mice. The coamplification was accomplished using a set of conserved sequence primers (mhIgβ forward and reverse; Table 2; white horizontal arrows). The PCR product spans exons 5 and 6, permitting size spliced RNA products. The cDNAs corresponding to human and mouse mRNAs were differentiated by restriction enzyme cleavage. Digestion of the 5′ 32P end-labeled cDNA products with SfcI (S) will exclusively generate the hCD79b cDNA product (95 bp), whereas digestion with HinfI (H) exclusively generates the mCD79b cDNA product (63 bp). A diagram of the predicted fragment migration on an analytic gel is represented. C to G. hCD79b mRNA expression in B cells of each CD79b transgenic mouse line. For each transgene, five independent lines with unique transgene insertion sites were analyzed. Signals corresponding to the human and mouse CD79b mRNAs were determined according to the scheme depicted in panel B. The SfcI (S) and HinfI (H) digestion products were quantified, and the human/mouse mRNA ratio was divided by the transgene copy number (indicated below each pair of lanes). The results of hCD79b mRNA expression per transgene copy were expressed as a percentage of a single endogenous mCD79b gene (also shown below each pair of lanes). H. Summary of CD79b mRNA expression in B cells of the six transgenic mouse lines. The hCD79b expression percentages derived from analysis of each of the transgenic lines (C to G) are displayed on the semilog plot. The value from each line, shown as a diamond, reflects the average of two or more independent assays. The data from the hGH/P1 lines have been previously reported (5) and are included to facilitate comparisons.
FIG. 4.
FIG. 4.
Human CD79b transgene containing the 0.2-kb minimal promoter (−0.2CD79b) maintains B-cell specificity. Total RNAs purified from the indicated tissues of a −0.2CD79b transgenic mouse (1294E) were analyzed by Northern blot hybridization. A human-specific CD79b probe was used to detect hCD79b mRNA. The level of mouse 18S rRNA served as a loading and transfer control.
FIG. 5.
FIG. 5.
Histone acetylation profiles at the hCD79b/GH locus in B-cell chromatin are predominantly localized to the area of CD79b. A. Diagram of the hCD79b/GH locus. The position of each amplimer set used in the chromatin immunoprecipitation (ChIP) analysis is indicated below the diagram (labeled dashes). B. Patterns of histone H3 and H4 acetylation throughout the human hCD79b/GH region in a B-cell line expressing high levels of CD79b mRNA. Chromatin from line 1484 was used as a representative high-expressing line (Fig. 1B). DNAs isolated from anti-acetyl H3 and anti-acetyl H4 ChIPs were amplified with the indicated primer sets and normalized (described in Materials and Methods). Each histone modification value was calculated as the ratio of DNA in the antibody-bound chromatin to that in the input sample. Mean histone H3 acetylation (dark bars) and histone H4 acetylation (light bars) are plotted. The amplimer regions analyzed are indicated underneath each pair of bars. The means ± standard deviations are representations of a minimum of two independent assays. C. Patterns of histone H3 and H3 acetylation in a plasma cell line with low levels of CD79b. U266 was selected as a representative B-cell line expressing trace levels of CD79b mRNA (Fig. 1B). Analyses and labeling are as described for panel B. D. Patterns of histone H3 and H4 acetylation in an erythroid cell line. The K562 erythroleukemia line does not express CD79b mRNA (Fig. 1B). E. Patterns of histone H3 and H4 acetylation in splenic B cells expressing hCD79b from an hGH/P1 transgenic mouse (line 811D). F. Patterns of histone H3 and H4 acetylation in liver tissue from the same hGH/P1 transgenic mouse used in the experiment depicted in panel E (line 811D).
FIG. 6.
FIG. 6.
Histone H3 lysine 4 dimethylation (H3K4me2) profiles at the hCD79b/GH locus. Experimental details are the same as those described in the legend to Fig. 5, except that anti-H3K4me2 was utilized for immunoprecipitation. The histogram represents a single assay in each case.
FIG. 7.
FIG. 7.
Comparison of chromatin structures and gene activation pathways at the hCD79b/GH locus in pituitary tissue, placenta tissue, and B cells. The hCD79b/GH locus is diagrammed with the set of DNase I HS present in each tissue. Transcriptional activities are denoted by angled arrows at the indicated promoters. The “bystander” transcription of CD79b in the pituitary gland is indicated. Regions of H3 and H4 hyperacetylation are indicated by the shaded ovals below the diagrams. Proposed pathways of gene activation are indicated as long-range “spreading” (pituitary), “looping” (placenta), or “local” (B cell).

Similar articles

Cited by

References

    1. Baumeister, P., S. Luo, W. C. Skarnes, G. Sui, E. Sato, Y. Shi, and A. S. Lee. 2005. Endoplasmic reticulum stress induction of the Grp78/BiP promoter: activating mechanisms mediated by YY1 and its interactive chromatin modifiers. Mol. Cell. Biol. 25:4529-4540. - PMC - PubMed
    1. Bell, A. C., A. G. West, and G. Felsenfeld. 1997. The protein CTCF is required for the enhancer blocking activity of vertebrate insulators. Cell 98:387-396. - PubMed
    1. Bennani-Baiti, I. M., N. E. Cooke, and S. A. Liebhaber. 1998. Physical linkage of the human growth hormone gene cluster and the CD79b(Igβ/B29) gene. Genomics 48:258-264. - PubMed
    1. Benschop, R. J., and J. C. Cambier. 1999. B cell development: signal transduction by antigen receptors and their surrogates. Curr. Opin. Immunol. 11:143-151. - PubMed
    1. Cajiao, I., A. Zhang, E. J. Yoo, N. E. Cooke, and S. A. Liebhaber. 2004. Bystander gene activation by a locus control region. EMBO J. 23:3854-3863. - PMC - PubMed

Publication types

LinkOut - more resources