. 2006 Aug 1;20(15):2082-95.
doi: 10.1101/gad.1441306. Epub 2006 Jul 17.

Txr1: a transcriptional regulator of thrombospondin-1 that modulates cellular sensitivity to taxanes

Affiliations

Txr1: a transcriptional regulator of thrombospondin-1 that modulates cellular sensitivity to taxanes

Chih-Jian Lih et al. Genes Dev. .

Abstract

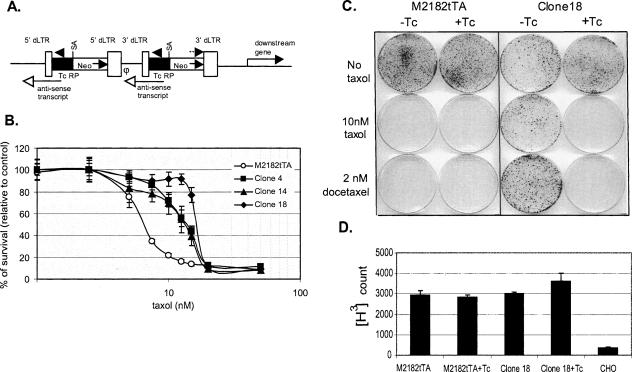
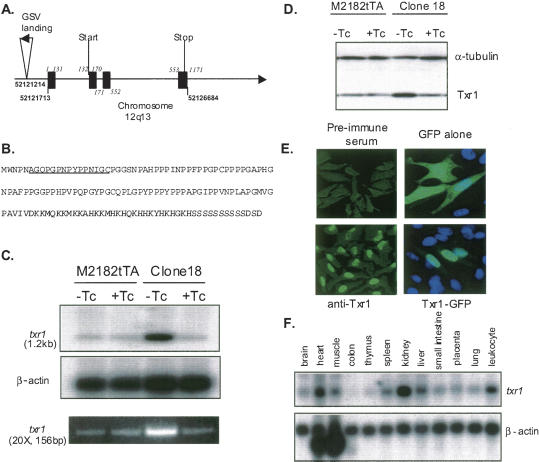
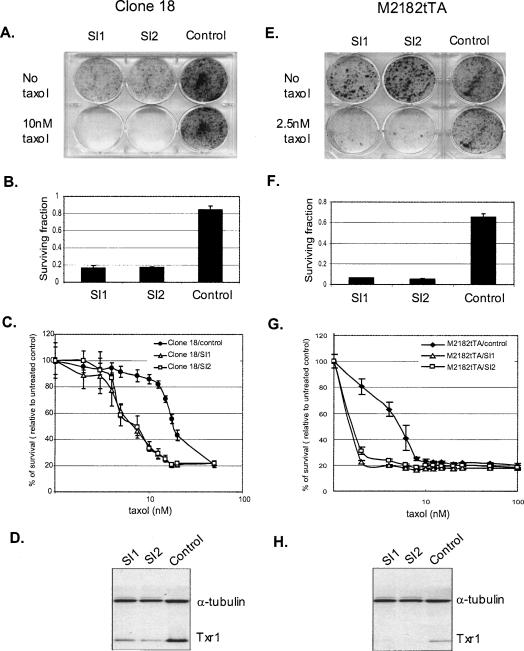
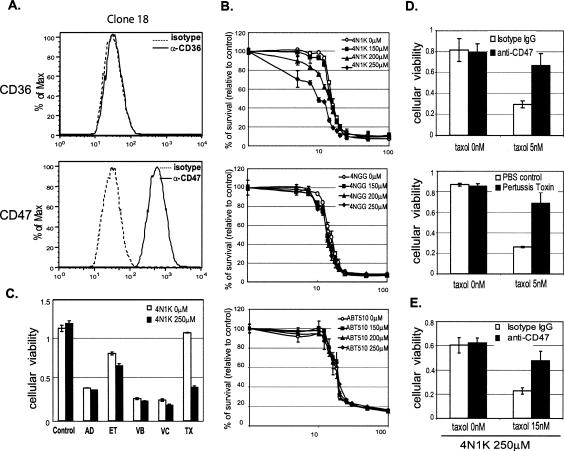
Using transcripts initiated at a chromosomally integrated retrovirus-based promoter to perturb gene expression randomly in human prostate cancer cells, we isolated cell clones resistant to taxane lethality and discovered the role of a previously uncharacterized gene, txr1, in this phenotype. We show that txr1 impedes taxane-induced apoptosis in tumor cells by transcriptionally down-regulating the production of thrombospondin-1 (TSP-1)--known earlier for both its anti-angiogenic and proapoptotic actions. Decrease of Txr1 or treatment with TSP-1 or TSP-1 mimetic peptide sensitized cells to taxane cytotoxicity by activating signaling through the CD47 receptor (also known as the integrin-associated protein), whereas interference with CD47 function reduced taxane-induced cell death. Cellular abundance of Txr1 and TSP-1 varied inversely, and alteration of the level of both proteins correlated highly with taxol resistance in 13 of 19 NCI-60 cancer cell lines. Our results reveal a hitherto unsuspected mechanism of taxane resistance, elucidate the role of txr1 in this resistance, and identify txr1 as a regulator of TSP-1 production and an agent for its chemotherapeutic modulation.


Figures

Figure 1.
Figure 1.
Identification and characterization of taxol-resistant cell clones. (A) Structure of integrated provirus derived from retroviral gene search vector (GSV2). 3′dLTR or 5′dLTR (open boxes) designate defective retroviral long terminal repeats lacking promoter and enhancer sequences required for virion production; (SA) splicing acceptor site from adenovirus; (neo) reporter gene encodes resistance to G418 (arrow in box indicates the “sense” direction of transcription; broken arrow at the top indicates the location and 5′-to-3′ direction of the primer used for cloning genes adjacent to the integration site); (TcRP [filled box]), tetracycline regulated promoter (arrowhead above this box indicates the direction of transcription; lines with open arrowhead below this box indicate anti-sense transcript originating from TcRP); (φ) virus packaging signal. (B) Survival of cell clones resistant to taxol as determined by MTT assay. The percentage of surviving cells (Y-axis) at the indicated taxol concentrations (in nanomolar [nM]; X-axis) was calculated from MTT assay readouts relative to the untreated control (set as 100%). Each data point represents the mean ± SD from eight replicates. (C) Tc modulation of taxane resistance in clone 18. Cellular sensitivity to taxanes was analyzed by plate assays in the presence (+Tc) or absence (−Tc) of tetracycline (1 μg/mL) as described in Materials and Methods. (D) Taxol uptake in clone 18. Cell lines were incubated with [3H] taxol in the presence or absence of Tc, and uptake was determined by scintillation counting. Chinese hamster ovary (CHO) cells with high efflux activity (Parekh and Simpkins 1996) were used as control. Each histogram represents the mean ± SD of four independent experiments.
Figure 2.
Figure 2.
Cloning, expression, and localization of txr1. (A) Schematic diagram of the GSV2 integration site in clone 18 and txr1 gene structure. Integration site of GSV2 provirus (inverse triangle; arrowhead indicates the direction of transcription from the Tc-regulated promoter) is shown at Chromosome locus 12q13 (horizontal line). The genomic nucleotide coordinates for the integration site and for the start and the end of txr1 transcripts are indicated in bold type. Four exons of the txr1 gene are shown as solid boxes, and their coordinates are italicized. The codons initiating and terminating translation (start and stop, respectively) are indicated. (B) Txr1 protein sequence deduced from cDNA sequence. The peptide used as antigen for raising antibodies is underlined. (C) Tc modulation of txr1 transcript in clone 18. txr1 transcript abundance in the presence or absence of Tc was analyzed by Northern blotting (top panels). The same RNAs were used as template for RT-PCR analysis (bottom panel). The cycle number and product size of the product are indicated. (D) Tc modulation of Txr1 protein in clone 18. Txr1 protein abundance in the presence or absence of Tc was measured by immunoblotting analysis. (E) Intracellular localization of Txr1. HeLa cells were immunofluorescence-stained with preimmune serum (upper left) or anti-Txr1 polyclonal antibodies (lower left). Chinese hamster ovary cells transfected with pCMV-EGFPN1 (upper right) or pEGFPTxr1 (lower right) were stained with DAPI (blue). Fluorescent images were obtained by confocal microscopy. (F) Multiple tissue Northern blot.
Figure 3.
Figure 3.
Down-regulation of txr1 by siRNA reduces the taxol resistance of clone 18 (A–D) and increases taxol sensitivity of naive M2182tTA cells (EH). (A,E) Effect of Txr1 deficiency on taxol resistance. Clone 18 (A) and M2182tTA cells (E) were transfected with siRNA (SI1 and SI2) against txr1 and with a scrambled-sequence control and then seeded for plate assay in the presence of 10 nM taxol (for clone 18) and 2.5 nM taxol (for M2182tTA). (B,F) Quantitative measurement of surviving cell fraction. Crystal violet-stained surviving cells in A and E were incubated with DMSO, and the absorbance was measured as indicated in Materials and Methods. The fraction of surviving cells was determined by normalizing the readouts from taxol-treated cells (A,E, lower row) to untreated controls (A,E, upper row). Results are means ± SD of two independent experiments. (C,G) Effect of anti-Txr1 siRNA on cell survival. Cells transfected with siRNA were analyzed by MTT assay as indicated in Materials and Methods. Each data point represents the mean ± SD from four replicates. (D,H) Immunoblotting analysis effects of siRNA on Txr1 protein abundance. Cell lysates of siRNA transfected cells were subjected to immunoblotting analysis.
Figure 4.
Figure 4.
Up-regulation of Txr1 increases taxol resistance in naive cells. (A) Immunoblotting analysis. M2182tTA was infected with virus derived from pLESTTxr1HA, and two permanently expressing clones R1 (B) and R2 (C) were isolated. Cell lysates of cells in the presence or absence of 1 μg/mL Tc were subjected to immunoblotting analysis. (B,C) Effect of Txr1 overexpression on taxol resistance in naive cells. Cells of clones R1 (B) and R2 (C) were then seeded for plate assay at indicated taxol concentrations in the presence or absence of 1 μg/mL Tc. (D,E) Quantitative measurement of surviving fraction of clones R1 (D) and R2 (E). Crystal violet-stained surviving cells in B and C were incubated with DMSO, and the absorbance was measured as indicated in Materials and Methods. The fraction of surviving cells was determined by normalizing the readouts from taxol-treated cells to untreated controls (leftmost column in B and C).
Figure 5.
Figure 5.
Effect of Txr1 on transcription of TSP-1. (A) Graphic representation of global effects of Txr1 up-regulation on transcription as measured by cDNA microarray hybridization. cDNAs corresponding to mRNA extracted from indicated cells/conditions were labeled with Cy5 (typed in red) or Cy3 (typed in green) and mixed for competitive hybridization on microarrays. Three independent hybridizations were performed for each paired comparison. Color represents the direction of regulation in gene expression: green, decreased expression; red, increased expression; black, unchanged. Color saturation is proportional to the magnitude of the change in relative expression. The gene list is provided in Supplemental Table S2. Expression profiles for Txr1 and TSP-1 are displayed in the lower panel. (B) Northern blot analysis confirms the reciprocal gene expression of Txr1 and TSP1. (C) Correlations between expression profiles of txr1 (green squares) and TSP-1 (red circles) and with cellular sensitivity to taxol (blue triangles) in tumor cell lines. Data for gene expression and taxol sensitivity were extracted and analyzed as described in Materials and Methods. The Y-axis represents either expression data (green and red curves) that have been transformed into the base 2 logarithm, or taxol sensitivity (blue curve) that was represented as the negative base 10 logarithm of GI50 (−log GI50; drug concentration caused 50% of growth inhibition in molar units). The X-axis indicates each of 13 cancer cell lines, which are (1) OVCAR-4 (ovarian cancer), (2) ADR-RES (unknown), (3) HS_578T (breast cancer), (4) SNB-75 (central nerve system tumor cell line), (5) SF-268 (glioblastoma), (6) SK-MEL-2 (melanoma), (7) MDA-MB-231 (breast cancer), (8) RXF-393 (renal carcinoma), (9) U251 (glioblastoma), (10) SK-OV-3 (ovarian cancer), (11) UO-31 (renal carcinoma), (12) EKVX (non-small-cell lung cancer), and (13) BT-549 (breast cancer). Pearson correlation coefficients between profiles of gene expression or profiles of gene expression and taxol sensitivity are shown. (D) Immunoblotting analysis of expression of TSP-1 and Txr1 proteins in NCI-60 cell lines. Lanes 14 represent cell lines 1–4 in C (OVCAR4, ADR_RES, HS578T, SNB-75). (E) Luciferase assay for TSP-1 promoter activity. pTSP1.7Luc was introduced by transfection, and cells were cultured in the presence or absence of Tc. Protein abundance (upper panel) of Txr1 and TSP-1 and luciferase activity were measured 2 d later. Relative luciferase units were calculated by normalizing luciferase activity with β-gal activity (lower panel) in cotransfected cells. Results represent the mean ± SD from three independent measurements.
Figure 6.
Figure 6.
TSP-1 effect on taxol resistance. (A) Dosage-dependent reversal of taxol resistance in clone 18 by TSP-1. Viability of clone 18 cells treated with the indicated concentrations of TSP-1 was assessed by MTT assay at various concentrations of taxol. Each data point represents the mean ± SD from four replicates. (B) The drug-sensitizing effect of TSP-1 is specific to taxol. Viability of clone 18 cells treated with indicated anti-cancer drugs in the presence or absence of TSP-1 was assessed by MTT assay. Histograms represent the mean ± SD of four independent repeat experiments. (AD) 250 ng/mL adriamycin, (ET) 1 μM etoposide, (VB) 10 nM vinblastine, (VC) 10 nM vincristine, (EpoB) 7.5 nM epothilone B, and (TX) 10 nM taxol. (C) TSP-1 effects on taxol sensitivity of naive cells. Viability of M2182tTA cells treated with taxol or TSP-1 alone, or with both, as indicated, was assessed by MTT assay. Images of wells after MTT color reaction are displayed in the left panel. Histograms represent the mean ± SD of four independent repeats. (D) The drug-sensitizing effect of TSP-1 is specific to taxol in naive cells. (E) TSP-1 enhances cellular sensitivity to taxol by triggering apoptotic cell death. Apoptotic cells of clone 18 cells treated with taxol or TSP-1 alone, or both, as indicated, were assessed by TUNEL assay and viewed by confocal microscopy. The bright green fluorescent nuclear spots represent TUNEL-positive cells. (F) Immunoblotting analysis of M2182tTA cells transfected with siRNA against TSP-1. (G) Effect of TSP-1 deficiency on taxol resistance in naive cells. Taxol sensitivity of M2182tTA cells transfected with siRNA against TSP-1 or a scrambled-sequence control was analyzed by plate assay.
Figure 7.
Figure 7.
TSP-1 signaling is mediated through CD47. (A) Expression of TSP-1 receptors on clone 18 cells. Clone 18 cells were stained with anti-CD36 antibody (upper panels), anti-CD47 (lower panels), and isotype control immunoglobulin (dotted lines) and analyzed by flow cytometry. The X-axis in the histogram is the fluorescence intensity, and the Y-axis is the frequency in percentage (maximum number is set as 100%). (B) Effect of 4N1K (CD47 agonist peptide) on taxol sensitivity. Cell viability of clone 18 cells treated with the indicated concentrations of TSP-1 mimetic peptides (4N1K, top panel; 4NGG, middle panel; ABT-510, lower panel) was assessed by MTT assay at various concentrations of taxol. Each data point represents the mean ± SD from four replicates. (C) 4N1K enhancement of drug sensitivity is specific to taxol. Cell viability of clone 18 cells treated with indicated drugs in the presence or absence of 4N1K was assessed by MTT assay. Abbreviations are the same as in Figure 6C. (D) Effect of anti-CD47 antibody and pertussis toxin on taxol cytotoxicity. Cell viability of M2182tTA cells treated with the indicated concentrations of taxol in the presence of 10 μg/mL anti-CD47 antibody or control isotype IgG (top panel) or 0.5 μg/mL pertussis toxin (lower panel) was assessed by MTT assay. (E) Anti-CD47 antibody abrogates the effect of 4N1K on reversal of taxane resistance in clone 18. Cell viability of clone 18 cells treated with 250 μM 4N1K in the presence of 10 μg/mL of anti-CD47 antibody or control isotype IgG was accessed by MTT assay at the indicated taxol concentration.

Similar articles

Cited by

References

    1. Bae V.L., Jackson-Cook C.K., Maygarden S.J., Plymate S.R., Chen J., Ware J.L. Metastatic sublines of an SV40 large T antigen immortalized human prostate epithelial cell line. Prostate. 1998;34:275–282. - PubMed
    1. Berns K., Hijmans E.M., Mullenders J., Brummelkamp T.R., Velds A., Heimerikx M., Kerkhoven R.M., Madiredjo M., Nijkamp W., Weigelt B., et al. A large-scale RNAi screen in human cells identifies new components of the p53 pathway. Nature. 2004;428:431–437. - PubMed
    1. Blystone S.D., Graham I.L., Lindberg F.P., Brown E.J. Integrin αvβ3 differentially regulates adhesive and phagocytic functions of the fibronectin receptor α5β1. J. Cell Biol. 1994;127:1129–1137. - PMC - PubMed
    1. Bradley G., Ling V. P-Glycoprotein, multidrug resistance and tumor progression. Cancer Metastasis Rev. 1994;13:223–233. - PubMed
    1. Brown E.J., Frazier W.A. Integrin-associated protein (CD47) and its ligands. Trends Cell Biol. 2001;11:130–135. - PubMed

Publication types

MeSH terms