. 2006 Jul 21;2(7):e92.
doi: 10.1371/journal.pcbi.0020092. Epub 2006 Jun 5.

Toward a census of bacteria in soil

Affiliations

Toward a census of bacteria in soil

Patrick D Schloss et al. PLoS Comput Biol. .

Abstract

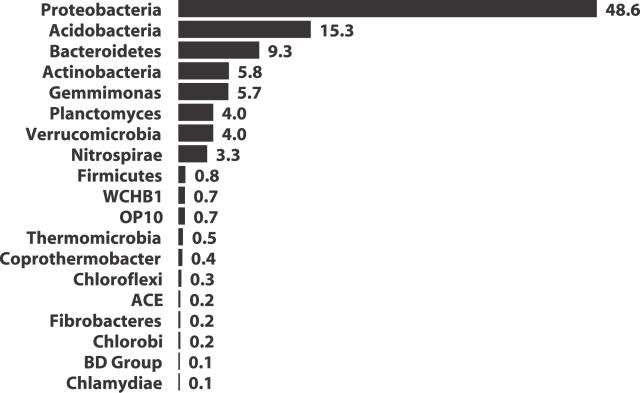
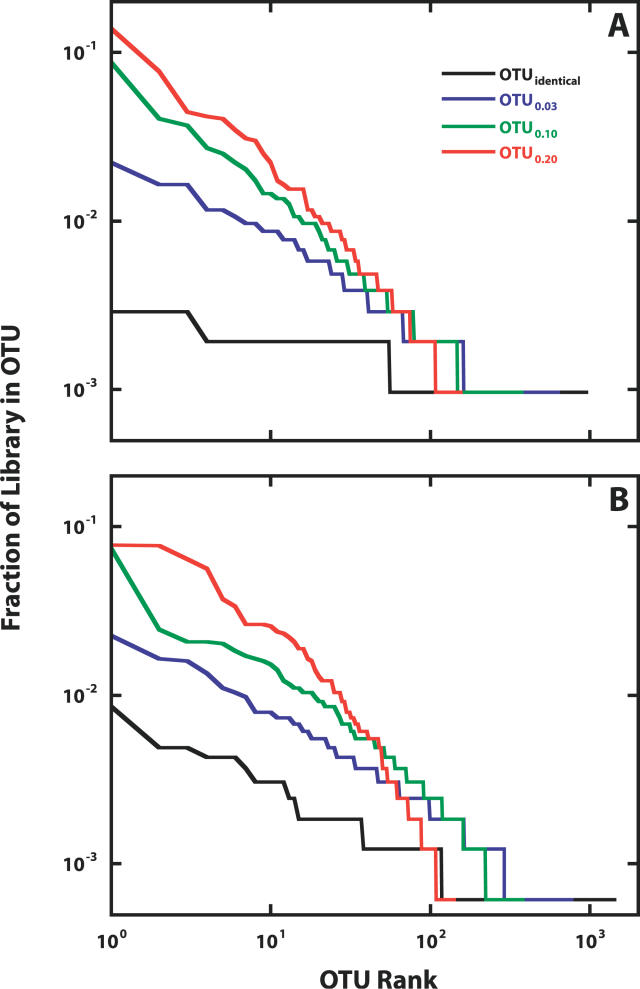
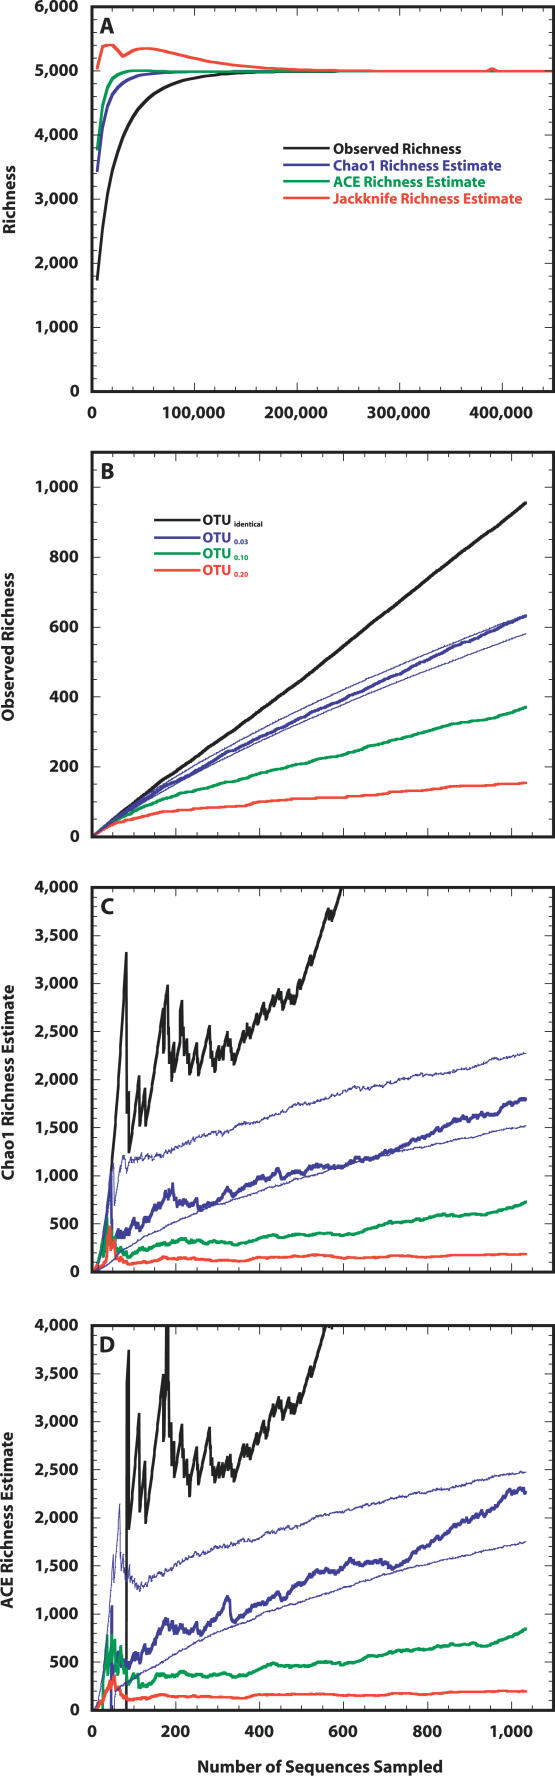
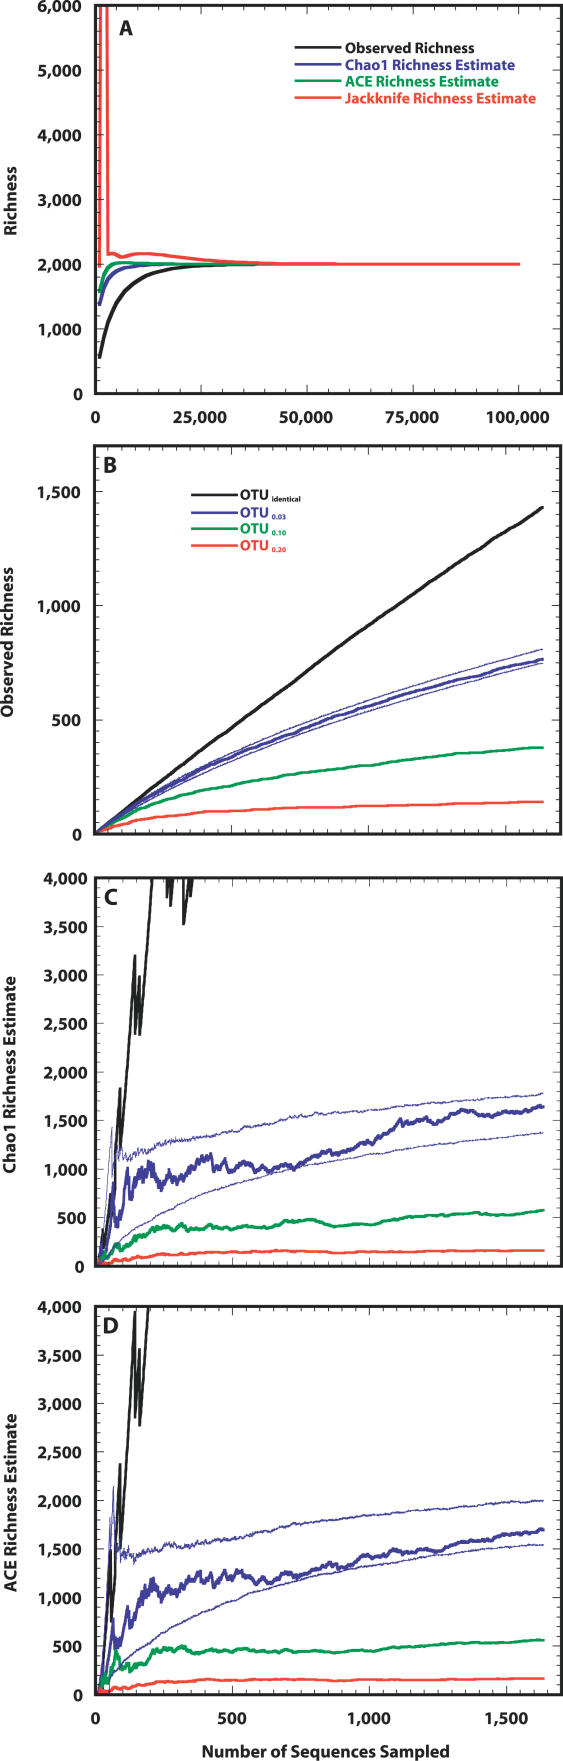
For more than a century, microbiologists have sought to determine the species richness of bacteria in soil, but the extreme complexity and unknown structure of soil microbial communities have obscured the answer. We developed a statistical model that makes the problem of estimating richness statistically accessible by evaluating the characteristics of samples drawn from simulated communities with parametric community distributions. We identified simulated communities with rank-abundance distributions that followed a truncated lognormal distribution whose samples resembled the structure of 16S rRNA gene sequence collections made using Alaskan and Minnesotan soils. The simulated communities constructed based on the distribution of 16S rRNA gene sequences sampled from the Alaskan and Minnesotan soils had a richness of 5,000 and 2,000 operational taxonomic units (OTUs), respectively, where an OTU represents a collection of sequences not more than 3% distant from each other. To sample each of these OTUs in the Alaskan 16S rRNA gene library at least twice, 480,000 sequences would be required; however, to estimate the richness of the simulated communities using nonparametric richness estimators would require only 18,000 sequences. Quantifying the richness of complex environments such as soil is an important step in building an ecological framework. We have shown that generating sufficient sequence data to do so requires less sequencing effort than completely sequencing a bacterial genome.


Conflict of interest statement

Competing interests. The authors have declared that no competing interests exist.

Figures

Figure 1
Figure 1. Phylum-Level Delineation of the 16S rRNA Gene Fragments in Alaskan Soil
Gene fragments (n = 1,033) were isolated and sequenced from an Alaskan soil. Candidate phyla WCHB1, OP10, ACE, and BD Group have no sequenced representatives.
Figure 2
Figure 2. Rank Abundance Plot of the Alaskan and Minnesotan 16S rRNA Gene Libraries
Alaskan (n = 1,033) (A) and Minnesotan (n = 1,633) (B) 16S rRNA gene libraries are plotted and describe the distribution of the 16S rRNA genes among OTUs defined as a group of sequences that are either identical or no more than 3%, 10%, or 20% different.
Figure 3
Figure 3. Estimating the Richness of Taxa in the Simulated Alaskan Soil Community
(A) Average number of taxa observed and estimated richness for the simulated Alaskan soil community (S T = 5,000, μ = 6.000, and σ = 3.020) over the course of randomly sampling 480,000 individuals. (B–D) The distribution of 16S rRNA sequences obtained from Alaskan soil falls within the 95% CI that would have been obtained for the distribution derived from sampling 1,033 individuals from this simulated community as measured using the observed (B) and estimated—Chao1 (C) and ACE (D)—richness. The thin blue lines in (B), (C), and (D) represent the 95% CIs for each metric using the simulated Alaskan soil community.
Figure 4
Figure 4. Estimating the Richness of Taxa in the Simulated Minnesotan Soil Community
(A) Average number of taxa observed and the estimated richness for the simulated Minnesotan soil community (S T = 2,000, μ = 8.000, and σ = 3.813) over the course of randomly sampling 100,000 individuals. (B–D) The distribution of 16S rRNA gene sequences obtained from the Minnesotan soil falls within the 95% CI that would have been obtained for the distribution derived from sampling 1,633 individuals from this simulated community as measured using the observed (B) and estimated—Chao1 (C) and ACE (D)—richness. The thin blue lines in (B), (C), and (D) represent the 95% CI for each metric using the simulated Minnesotan soil community.
Figure 5
Figure 5. Similarity of Alaskan and Minnesotan Soil Microbial Communities
Collector's curves describing the effect of sampling on the estimated fraction of sequences from the Minnesotan (red lines) and Alaskan (blue lines) libraries belonging to shared OTUs0.03 and OTUs0.20.

Similar articles

Cited by

References

    1. Whitman WB, Coleman DC, Wiebe WJ. Prokaryotes: The unseen majority. Proc Natl Acad Sci USA. 1998;95:6578–6583. - PMC - PubMed
    1. Begon M, Harper JL, Townsend CR. Ecology: Individuals, populations, and communities. 3rd ed. Malden (Massachusetts): Blackwell Science; 1996. pp. 829–830.
    1. Dunbar J, Takala S, Barns SM, Davis JA, Kuske CR. Levels of bacterial community diversity in four arid soils compared by cultivation and 16S rRNA gene cloning. Appl Environ Microbiol. 1999;65:1662–1669. - PMC - PubMed
    1. Amann RI, Ludwig W, Schleifer KH. Phylogenetic identification and in situ detection of individual microbial cells without cultivation. Microbiol Rev. 1995;59:143–169. - PMC - PubMed
    1. Ovreas L, Jensen S, Daae FL, Torsvik V. Microbial community changes in a perturbed agricultural soil investigated by molecular and physiological approaches. Appl Environ Microbiol. 1998;64:2739–2742. - PMC - PubMed

Publication types

LinkOut - more resources