

Ascorbate removes key precursors to oxidative damage by cell-free haemoglobin in vitro and in vivo
- PMID: 16848758
- PMCID: PMC1615907
- DOI: 10.1042/BJ20060341
Ascorbate removes key precursors to oxidative damage by cell-free haemoglobin in vitro and in vivo
Abstract
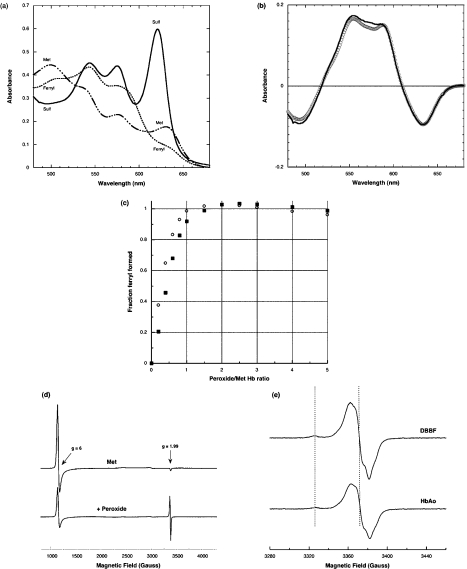
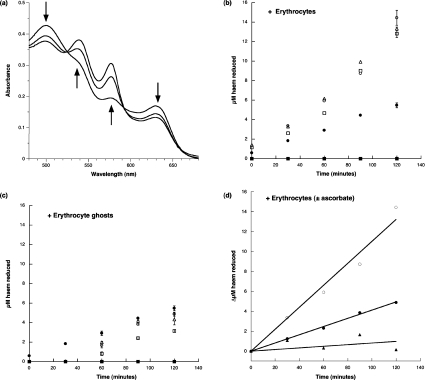
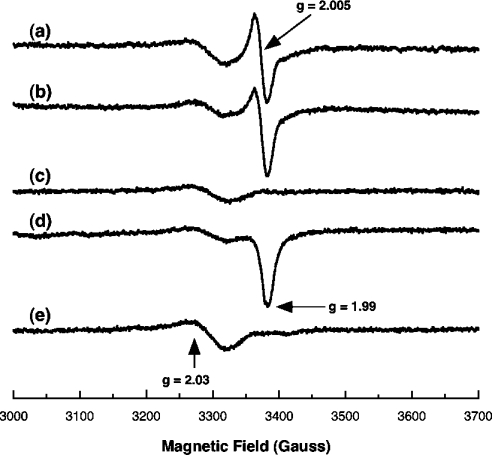
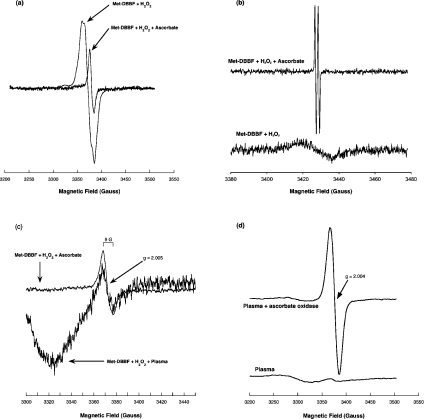
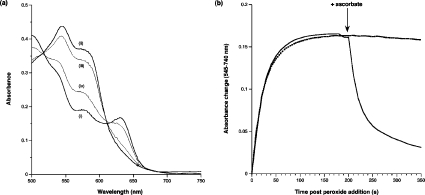
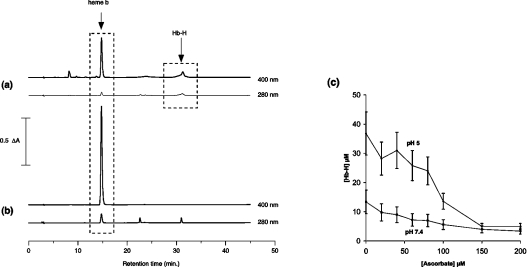
Haemoglobin initiates free radical chemistry. In particular, the interactions of peroxides with the ferric (met) species of haemoglobin generate two strong oxidants: ferryl iron and a protein-bound free radical. We have studied the endogenous defences to this reactive chemistry in a rabbit model following 20% exchange transfusion with cell-free haemoglobin stabilized in tetrameric form [via cross-linking with bis-(3,5-dibromosalicyl)fumarate]. The transfusate contained 95% oxyhaemoglobin, 5% methaemoglobin and 25 microM free iron. EPR spectroscopy revealed that the free iron in the transfusate was rendered redox inactive by rapid binding to transferrin. Methaemoglobin was reduced to oxyhaemoglobin by a slower process (t(1/2) = 1 h). No globin-bound free radicals were detected in the plasma. These redox defences could be fully attributed to a novel multifunctional role of plasma ascorbate in removing key precursors of oxidative damage. Ascorbate is able to effectively reduce plasma methaemoglobin, ferryl haemoglobin and globin radicals. The ascorbyl free radicals formed are efficiently re-reduced by the erythrocyte membrane-bound reductase (which itself uses intra-erythrocyte ascorbate as an electron donor). As well as relating to the toxicity of haemoglobin-based oxygen carriers, these findings have implications for situations where haem proteins exist outside the protective cell environment, e.g. haemolytic anaemias, subarachnoid haemorrhage, rhabdomyolysis.
Figures

Similar articles
-
Oxidation of Erythrocytes Enhance the Production of Reactive Species in the Presence of Artemisinins.Int J Mol Sci. 2020 Jul 7;21(13):4799. doi: 10.3390/ijms21134799. Int J Mol Sci. 2020. PMID: 32646002 Free PMC article.
-
Lipid peroxidation and haemoglobin degradation in red blood cells exposed to t-butyl hydroperoxide. Effects of the hexose monophosphate shunt as mediated by glutathione and ascorbate.Biochem J. 1982 May 15;204(2):405-15. doi: 10.1042/bj2040405. Biochem J. 1982. PMID: 7115337 Free PMC article.
-
Oxidative damage to human red cells induced by copper and iron complexes in the presence of ascorbate.Biochim Biophys Acta. 1989 Oct 30;1014(1):66-72. doi: 10.1016/0167-4889(89)90241-3. Biochim Biophys Acta. 1989. PMID: 2804091
-
Oxidative injury in neonatal erythrocytes.J Matern Fetal Neonatal Med. 2012 Oct;25(Suppl 5):104-8. doi: 10.3109/14767058.2012.715471. J Matern Fetal Neonatal Med. 2012. PMID: 23025782 Review.
-
Considerations on the mechanism of action of artemisinin antimalarials: part 1--the 'carbon radical' and 'heme' hypotheses.Infect Disord Drug Targets. 2013 Aug;13(4):217-77. doi: 10.2174/1871526513666131129155708. Infect Disord Drug Targets. 2013. PMID: 24304352 Review.
Cited by
-
Blood substitutes: evolution from noncarrying to oxygen- and gas-carrying fluids.ASAIO J. 2013 Jul-Aug;59(4):337-54. doi: 10.1097/MAT.0b013e318291fbaa. ASAIO J. 2013. PMID: 23820271 Free PMC article. Review.
-
Preservation of myocardial contractility during acute hypoxia with OMX-CV, a novel oxygen delivery biotherapeutic.PLoS Biol. 2018 Oct 18;16(10):e2005924. doi: 10.1371/journal.pbio.2005924. eCollection 2018 Oct. PLoS Biol. 2018. PMID: 30335746 Free PMC article.
-
The effect of maximum storage on iron status, oxidative stress and antioxidant protection in paediatric packed cell units.Blood Transfus. 2013 Jul;11(3):419-25. doi: 10.2450/2012.0046-12. Epub 2012 Sep 12. Blood Transfus. 2013. PMID: 23058860 Free PMC article.
-
Methemoglobinemia presenting in a circumcised baby following application of prilocaine: a case report.J Med Case Rep. 2010 Feb 10;4:49. doi: 10.1186/1752-1947-4-49. J Med Case Rep. 2010. PMID: 20181170 Free PMC article.
-
Involvement of ferryl in the reaction between nitrite and the oxy forms of globins.J Biol Inorg Chem. 2014 Oct;19(7):1233-9. doi: 10.1007/s00775-014-1181-y. Epub 2014 Jul 27. J Biol Inorg Chem. 2014. PMID: 25064750
References
-
- Alayash A. I., Patel R. P., Cashon R. E. Redox reactions of hemoglobin and myoglobin: biological and toxicological implications. Antioxid. Redox Signaling. 2001;3:313–327. - PubMed
-
- Catalano C. E., Choe Y. S., Ortiz de Montellano P. R. Reactions of the protein radical in peroxide-treated myoglobin: formation of a heme-protein cross-link. J. Biol. Chem. 1989;264:10534–10541. - PubMed
-
- Cooper C. E. Radical reactions of haem proteins. In: Galley H. F., editor. Critical Care Focus, Volume 8: Blood and Blood Transfusion. London: BMJ Books/Intensive Care Society; 2002. pp. 66–79.
-
- Gibson J. F., Ingram D. J. E., Nicholls P. Free radical produced in the reaction of metmyoglobin with hydrogen peroxide. Nature. 1958;181:1398–1399. - PubMed
-
- Cooper C. E. Ferryl iron and protein free radicals. In: Rice-Evans C. A., Burdon R. H., editors. Free Radical Damage and its Control. Amsterdam: Elsevier; 1994. pp. 65–109.
Publication types
MeSH terms
Substances
Grants and funding
LinkOut - more resources
Full Text Sources
Other Literature Sources
Medical
Research Materials
Miscellaneous