. 2006 Jul 18:6:56.
doi: 10.1186/1471-2148-6-56.

Tempo and mode of early gene loss in endosymbiotic bacteria from insects

Affiliations

Tempo and mode of early gene loss in endosymbiotic bacteria from insects

F Delmotte et al. BMC Evol Biol. .

Abstract

Background: Understanding evolutionary processes that drive genome reduction requires determining the tempo (rate) and the mode (size and types of deletions) of gene losses. In this study, we analysed five endosymbiotic genome sequences of the gamma-proteobacteria (three different Buchnera aphidicola strains, Wigglesworthia glossinidia, Blochmannia floridanus) to test if gene loss could be driven by the selective importance of genes. We used a parsimony method to reconstruct a minimal ancestral genome of insect endosymbionts and quantified gene loss along the branches of the phylogenetic tree. To evaluate the selective or functional importance of genes, we used a parameter that measures the level of adaptive codon bias in E. coli (i.e. codon adaptive index, or CAI), and also estimates of evolutionary rates (Ka) between pairs of orthologs either in free-living bacteria or in pairs of symbionts.

Results: Our results demonstrate that genes lost in the early stages of symbiosis were on average less selectively constrained than genes conserved in any of the extant symbiotic strains studied. These results also extend to more recent events of gene losses (i.e. among Buchnera strains) that still tend to concentrate on genes with low adaptive bias in E. coli and high evolutionary rates both in free-living and in symbiotic lineages. In addition, we analyzed the physical organization of gene losses for early steps of symbiosis acquisition under the hypothesis of a common origin of different symbioses. In contrast with previous findings we show that gene losses mostly occurred through loss of rather small blocks and mostly in syntenic regions between at least one of the symbionts and present-day E. coli.

Conclusion: At both ancient and recent stages of symbiosis evolution, gene loss was at least partially influenced by selection, highly conserved genes being retained more readily than lowly conserved genes: although losses might result from drift due to the bottlenecking of endosymbiontic populations, we demonstrated that purifying selection also acted by retaining genes of greater selective importance.


Figures

Figure 1
Figure 1
Phylogenetic tree based on an alignment of 61 concatenated conserved protein-coding genes involved in translation. DNA sequences were aligned using a protein alignment from clustalw, and then trimmed with Gblocks and limited to the first two codon positions resulting in 19143 nucleotides. The tree was reconstructed with NHML version 3 (Galtier 1998). LCA = Last Common Ancestor; Numbers in bold at the nodes indicate the number of protein coding genes (CDS) present at these steps. Numbers below the branches indicates the number of lost CDS since the last node. In front of each endosymbiotic lineage were indicated the chromosome size, the number of CDS and that of pseudogenes (assimilated to gene losses).
Figure 2
Figure 2
Relationship between frequency of gene loss in endosymbionts and adaptive codon bias (CAI) of the E. coli ortholog at different depths of the tree. y-axis: percentages of genes lost at least on one occasion between different nodes (or a node and a tip), x-axis: CAI classes of E. coli K12.
Figure 3
Figure 3
Three scenarios for ancestral genes: (A) Gene lost in all endosymbionts, presumably between LCA1 and LCA2 (B) Gene present in LCA2 but lost in some of the symbiotic lineages – here is a particular example were a gene has been lost independently in BBp, Wgl and Bfl (C) Gene kept in all endosymbionts. Solid lines represent the presence and dashed lines the absence of a gene.
Figure 4
Figure 4
Non-synonymous substitution rates calculated between E. coli and two free living bacteria (S. typhimurium and Y. pestis) for each loss scenario (A, B, C correspond to gene loss in all, some or none of the symbionts respectively). Global significance of differences between medians was tested by Mann-Whitney tests.
Figure 5
Figure 5
Non-synonymous substitution rates (Ka) calculated between pairs of endosymbionts for two different gene loss scenarios across all endosymbionts (B) Genes lost at least once, in some other symbiotic lineage; (C) Genes kept in all endosymbionts.
Figure 6
Figure 6
Determination of synteny and deletion events between three extant symbionts (BAp, BBp, Bfl) and their reconstructed free-living ancestor (LCA1), through "alignment" of orthologous genes ordered in each genome. Shaded arrows represent genes from the chosen fragment of LCA1 and still present in symbionts (open symbols for genes in symbionts represent genes from LCA1 present in another fragment) while genes of this fragment that were lost are represented by dotted arrows. The numbers below genes in symbionts show their rank in these genomes. The figure illustrates our approach in three steps: alignment between BAp and LCA1 suggest a non syntenic deletion of 8 genes. Alignment between BBp and LCA1 suggest a non syntenic deletion of 7 genes. Alignment between Bfl and LCA1 finally suggest a syntenic deletion of only 1 gene.
Figure 7
Figure 7
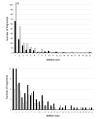
Distribution of deletion sizes in syntenic (upper graph) and non-syntenic (lower graph) fragments between LCA1 and LCA3 (filled bars) or between LCA1 and LCA2 (open bars).
Figure 8
Figure 8
Frequency of classes of deletions sizes (in number of genes) between LCA1 and LCA2, for syntenic fragments. Open triangles, observed frequencies. Open squares, expected frequencies if losses were random and deletions sizes followed a Pascal (geometric) law of mean P equal to the frequency of genes in syntenic fragments actually lost (P = 0.438). Inbedded histogram: i) open bars represent the difference in % between observed frequencies and simulated frequencies of size classes (averages of n = 150 simulations) for a constant probability of loss (H1 hypothesis) ii) open bars represent the difference in % between simulated frequencies for a probability of loss function of the CAI (H2 hypothesis) and for simulated frequencies under H1. The class "zero" corresponds to two adjacent syntenic genes conserved in LCA2 (i.e. no deletion occurred).

References

    1. Gil R, Sabater-Munoz B, Latorre A, Silva FJ, Moya A. Extreme genome reduction in Buchnera spp.: Toward the minimal genome needed for symbiotic life. Proc Natl Acad Sci. 2002;99:4454–4458. doi: 10.1073/pnas.062067299. - DOI - PMC - PubMed
    1. Tamas I, Klasson L, Canback B, Naslund AK, Eriksson AS, Wernegreen JJ, Sandstrom JP, Moran NA, Andersson SGE. 50 million years of genomic stasis in endosymbiotic bacteria. Science. 2002;296:2376–2379. doi: 10.1126/science.1071278. - DOI - PubMed
    1. Degnan PH, Lazarus AB, Wernegreen JJ. Genome sequence of Blochmannia pennsylvanicus indicates parallel evolutionary trends among bacterial mutualists of insects. Genome Res. 2005;15:1023–1033. doi: 10.1101/gr.3771305. - DOI - PMC - PubMed
    1. Belda E, Moya A, Silva FJ. Genome rearrangement distances and gene order phylogeny in gamma-Proteobacteria. Mol Biol Evol. 2005;22:1456–1467. doi: 10.1093/molbev/msi134. - DOI - PubMed
    1. Shigenobu S, Watanabe H, Hattori M, Sakaki Y, Ishikawa H. Genome sequence of the endocellular bacterial symbiont of aphids Buchnera sp. APS. Nature. 2000;407:81–86. doi: 10.1038/35024074. - DOI - PubMed

Publication types

LinkOut - more resources