

Unloading work of breathing during high-frequency oscillatory ventilation: a bench study
- PMID: 16848915
- PMCID: PMC1750967
- DOI: 10.1186/cc4968
Unloading work of breathing during high-frequency oscillatory ventilation: a bench study
Abstract
Introduction: With the 3100B high-frequency oscillatory ventilator (SensorMedics, Yorba Linda, CA, USA), patients' spontaneous breathing efforts result in a high level of imposed work of breathing (WOB). Therefore, spontaneous breathing often has to be suppressed during high-frequency oscillatory ventilation (HFOV). A demand-flow system was designed to reduce imposed WOB.
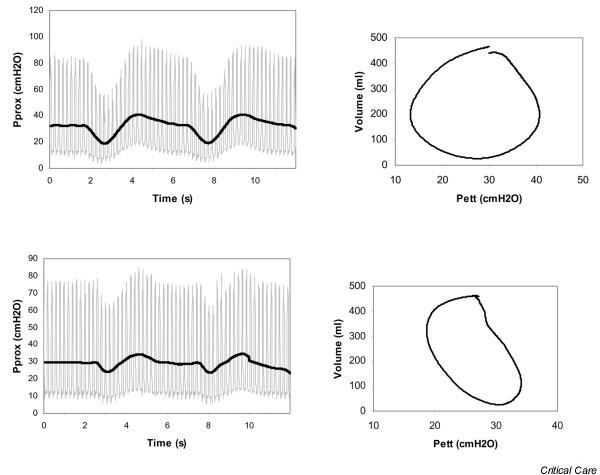
Methods: An external gas flow controller (demand-flow system) accommodates the ventilator fresh gas flow during spontaneous breathing simulation. A control algorithm detects breathing effort and regulates the demand-flow valve. The effectiveness of this system has been evaluated in a bench test. The Campbell diagram and pressure time product (PTP) are used to quantify the imposed workload.
Results: Using the demand-flow system, imposed WOB is considerably reduced. The demand-flow system reduces inspiratory imposed WOB by 30% to 56% and inspiratory imposed PTP by 38% to 59% compared to continuous fresh gas flow. Expiratory imposed WOB was decreased as well by 12% to 49%. In simulations of shallow to normal breathing for an adult, imposed WOB is 0.5 J l-1 at maximum. Fluctuations in mean airway pressure on account of spontaneous breathing are markedly reduced.
Conclusion: The use of the demand-flow system during HFOV results in a reduction of both imposed WOB and fluctuation in mean airway pressure. The level of imposed WOB was reduced to the physiological range of WOB. Potentially, this makes maintenance of spontaneous breathing during HFOV possible and easier in a clinical setting. Early initiation of HFOV seems more possible with this system and the possibility of weaning of patients directly on a high-frequency oscillatory ventilator is not excluded either.
Figures


Comment in
-
Allowing for spontaneous breathing during high-frequency oscillation: the key for final success?Crit Care. 2006;10(4):155. doi: 10.1186/cc4993. Crit Care. 2006. PMID: 16887013 Free PMC article. Review.
Similar articles
-
Allowing for spontaneous breathing during high-frequency oscillation: the key for final success?Crit Care. 2006;10(4):155. doi: 10.1186/cc4993. Crit Care. 2006. PMID: 16887013 Free PMC article. Review.
-
Imposed work of breathing during high-frequency oscillatory ventilation: a bench study.Crit Care. 2006 Feb;10(1):R23. doi: 10.1186/cc3988. Crit Care. 2006. PMID: 16469130 Free PMC article.
-
Design and control of a demand flow system assuring spontaneous breathing of a patient connected to an HFO ventilator.IEEE Trans Biomed Eng. 2011 Nov;58(11):3225-33. doi: 10.1109/TBME.2011.2165541. Epub 2011 Aug 22. IEEE Trans Biomed Eng. 2011. PMID: 21859597
-
Demand flow facilitates spontaneous breathing during high-frequency oscillatory ventilation in a pig model.Crit Care Med. 2009 Mar;37(3):1068-73. doi: 10.1097/CCM.0b013e318196153b. Crit Care Med. 2009. PMID: 19237919
-
[Proportional assist ventilation combined with automatic tube compensation. A promising concept of augmented spontaneous breathing?].Anaesthesist. 2003 Apr;52(4):341-8. doi: 10.1007/s00101-003-0470-6. Anaesthesist. 2003. PMID: 12715137 Review. German.
Cited by
-
CPAP and HFOV: different guises of the same underlying intensive care strategy for supporting RSV bronchiolitis.Intensive Care Med. 2008 Sep;34(9):1560-1. doi: 10.1007/s00134-008-1152-2. Epub 2008 May 24. Intensive Care Med. 2008. PMID: 18500422 No abstract available.
-
Allowing for spontaneous breathing during high-frequency oscillation: the key for final success?Crit Care. 2006;10(4):155. doi: 10.1186/cc4993. Crit Care. 2006. PMID: 16887013 Free PMC article. Review.
-
Year in review 2006: Critical Care--Respirology.Crit Care. 2007;11(4):224. doi: 10.1186/cc5963. Crit Care. 2007. PMID: 17764586 Free PMC article. Review.
-
Management of refractory hypoxemia.Ann Card Anaesth. 2016 Jan-Mar;19(1):89-96. doi: 10.4103/0971-9784.173030. Ann Card Anaesth. 2016. PMID: 26750680 Free PMC article. Review.
References
-
- Putensen C, Mutz NJ, Putensen-Himmer G, Zinserling J. Spontaneous breathing during ventilatory support improves ventilation-perfusion distributions in patients with acute respiratory distress syndrome. Am J Respir Crit Care Med. 1999;159:1241–1248. - PubMed
-
- Putensen C, Muders T, Varelmann D, Wrigge H. The impact of spontaneous breathing during mechanical ventilation. Curr Opin Crit Care. 2006;12:13–18. - PubMed
-
- Sydow M, Burchardi H, Ephraim E, Zielmann S, Crozier TA. Long-term effects of two different ventilatory modes on oxygenation in acute lung injury. Comparison of airway pressure release ventilation and volume-controlled inverse ratio ventilation. Am J Respir Crit Care Med. 1994;149:1550–1556. - PubMed
-
- Wrigge H, Zinserling J, Neumann P, Muders T, Magnusson A, Putensen C, Hedenstierna G. Spontaneous breathing with airway pressure release ventilation favors ventilation in dependent lung regions and counters cyclic alveolar collapse in oleic-acid-induced lung injury: a randomized controlled computed tomography trial. Crit Care. 2005;9:R780–R789. doi: 10.1186/cc3908. - DOI - PMC - PubMed
Publication types
MeSH terms
LinkOut - more resources
Full Text Sources
Other Literature Sources
