Review
. 2006 Feb;39(1):57-116.
doi: 10.1017/S0033583506004227. Epub 2006 Jul 19.

Computational biology in the study of cardiac ion channels and cell electrophysiology

Affiliations
Review

Computational biology in the study of cardiac ion channels and cell electrophysiology

Yoram Rudy et al. Q Rev Biophys. 2006 Feb.

Abstract

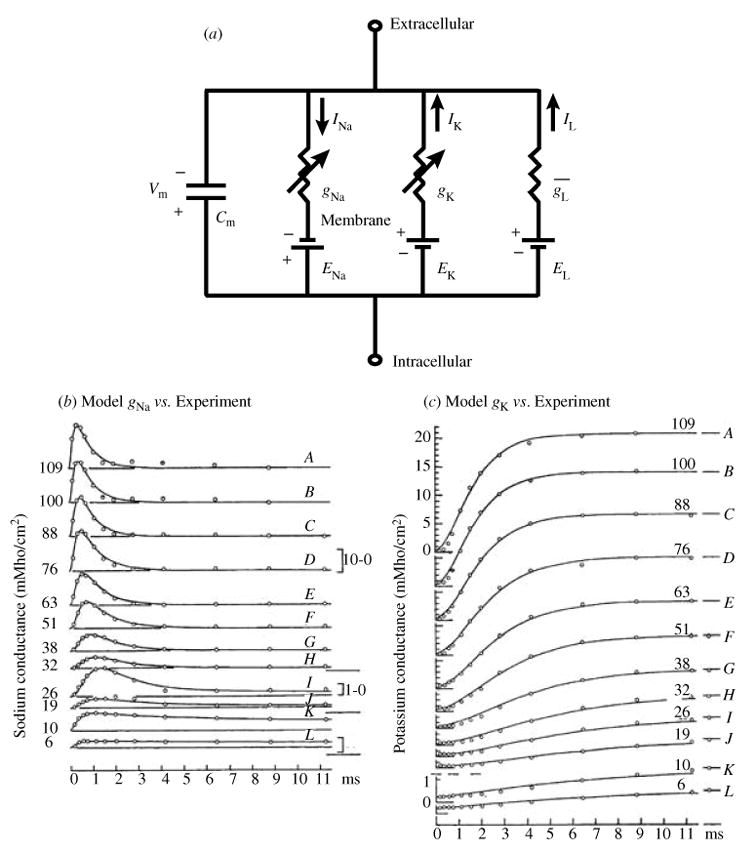
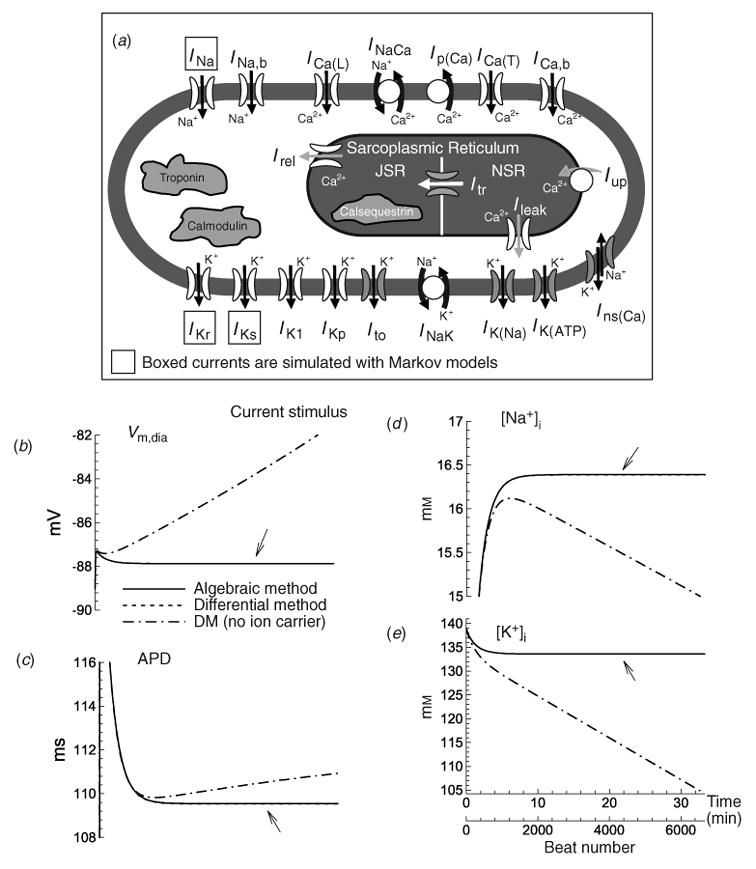
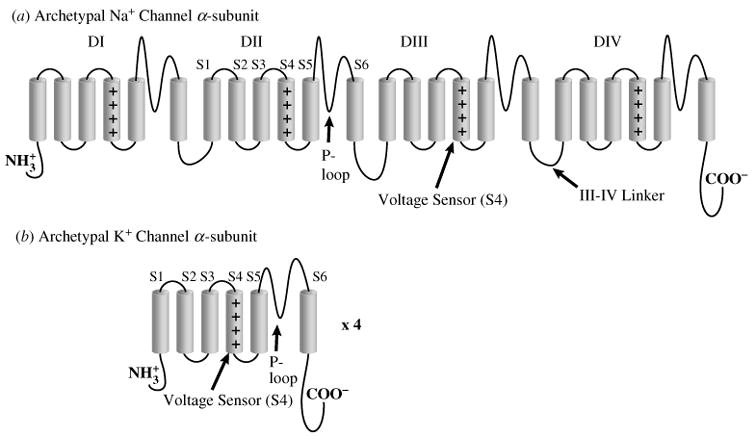
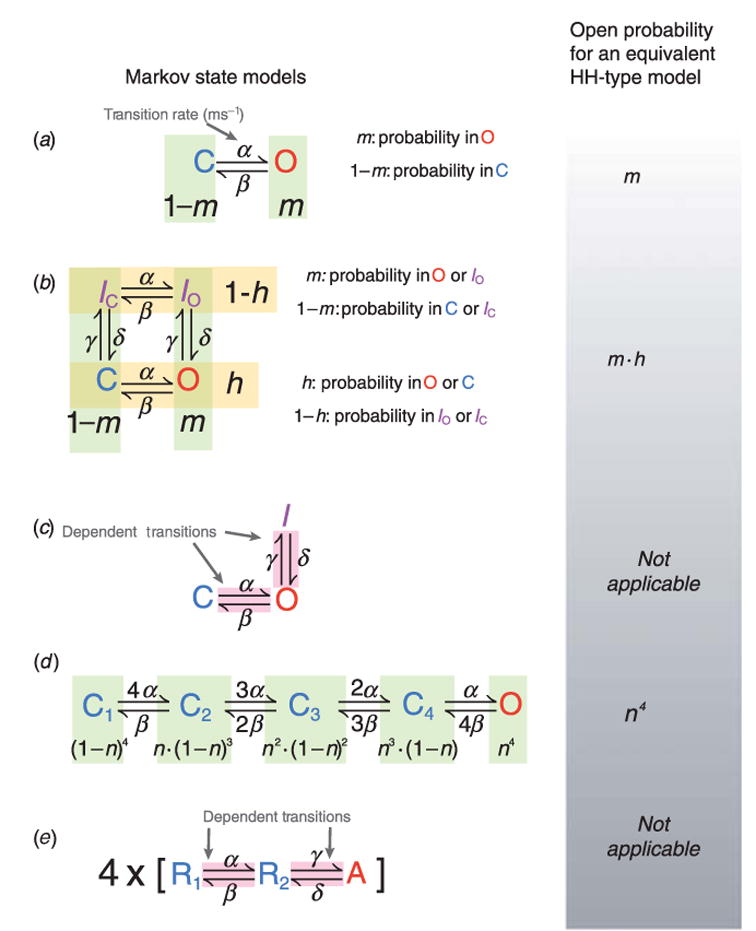
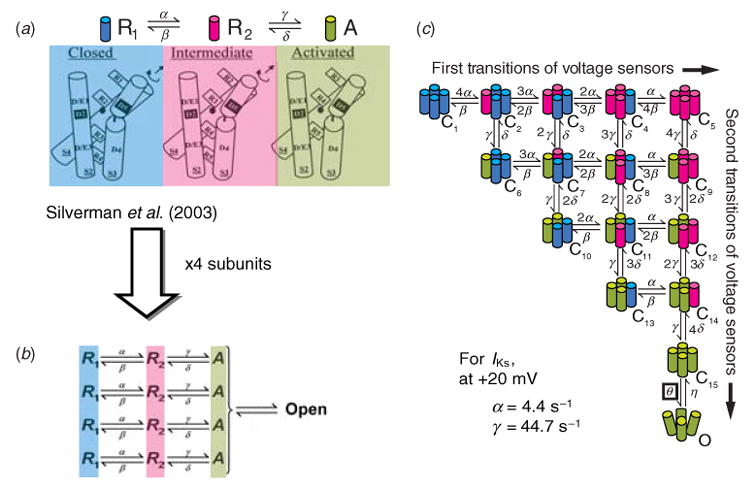
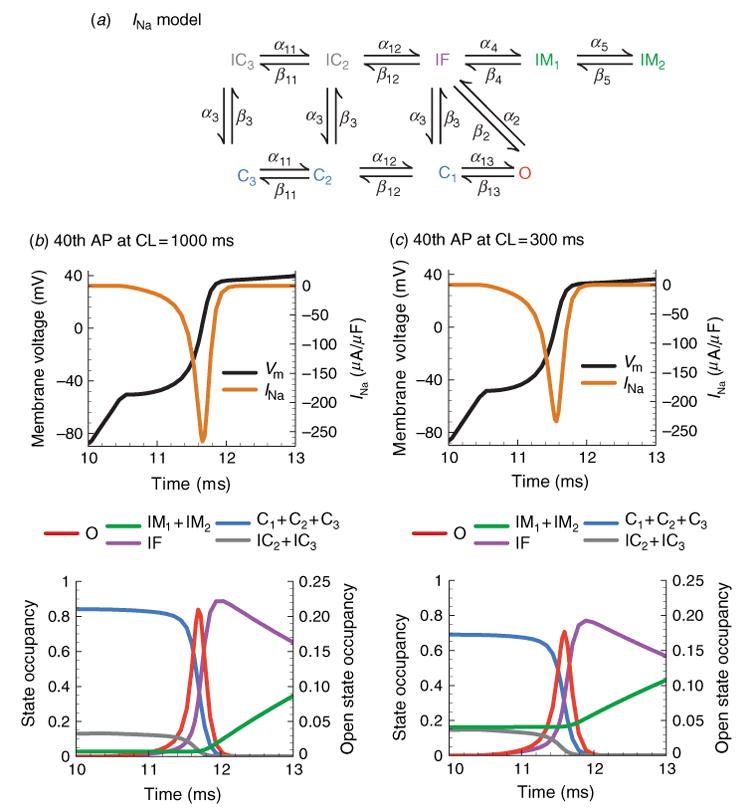
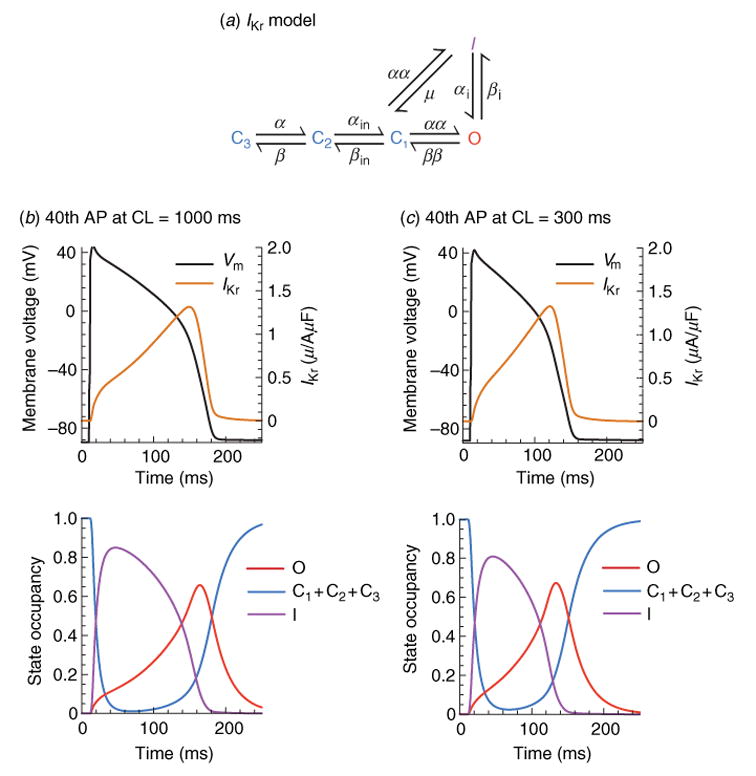
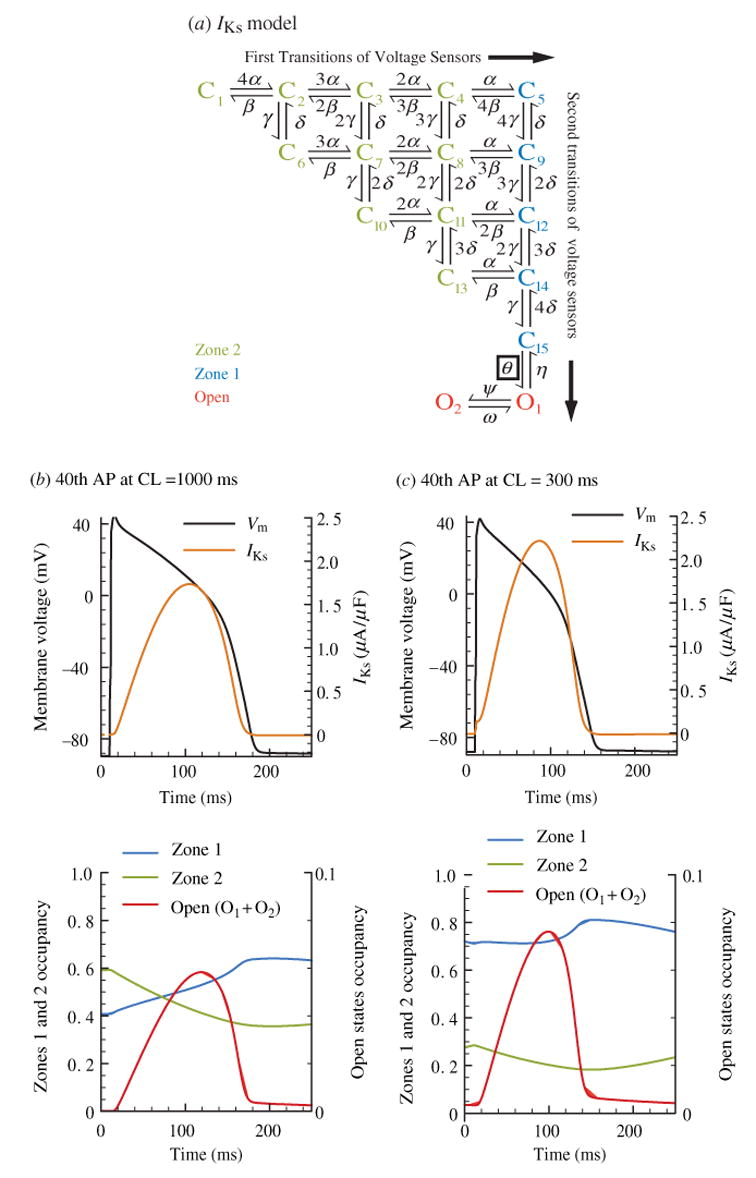
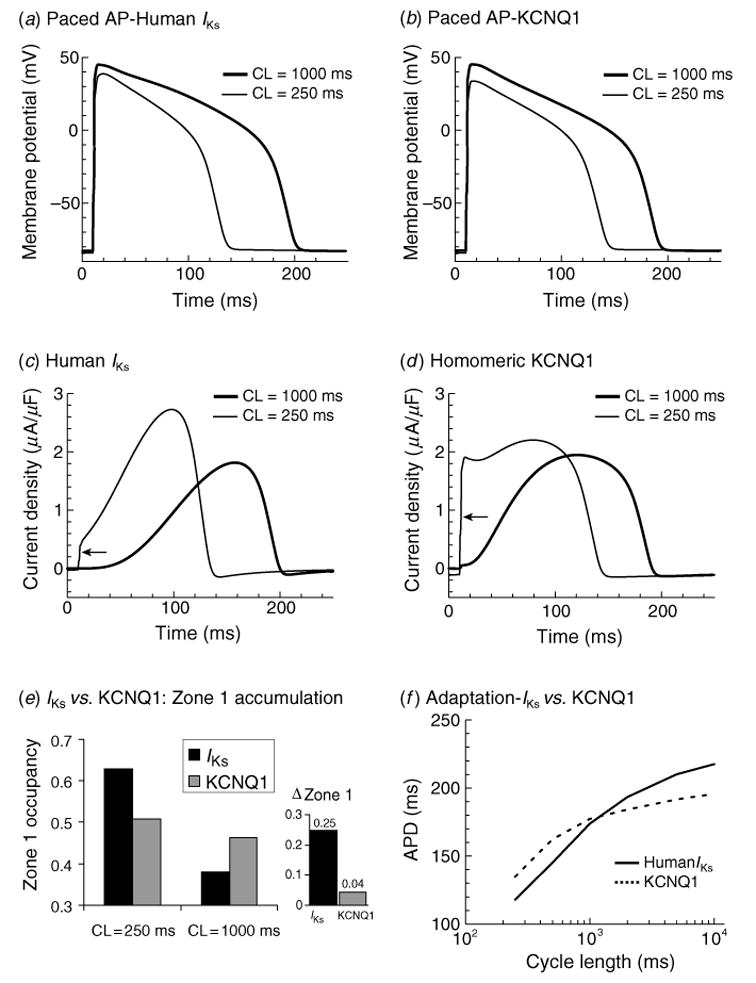
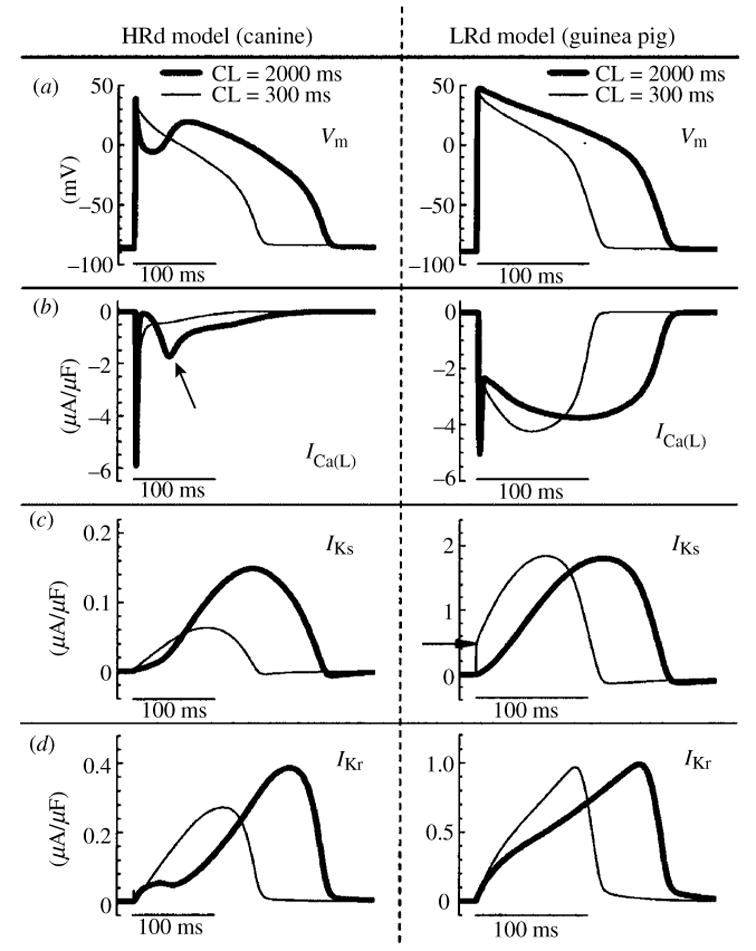
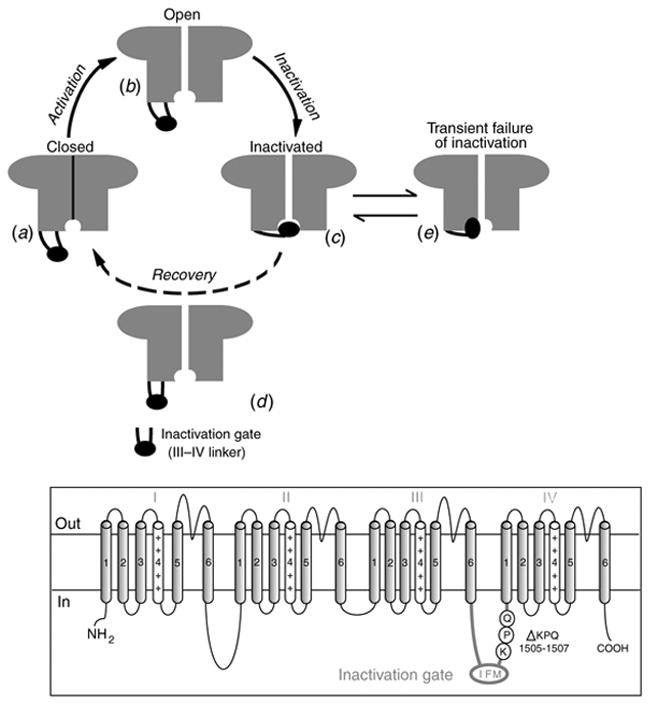
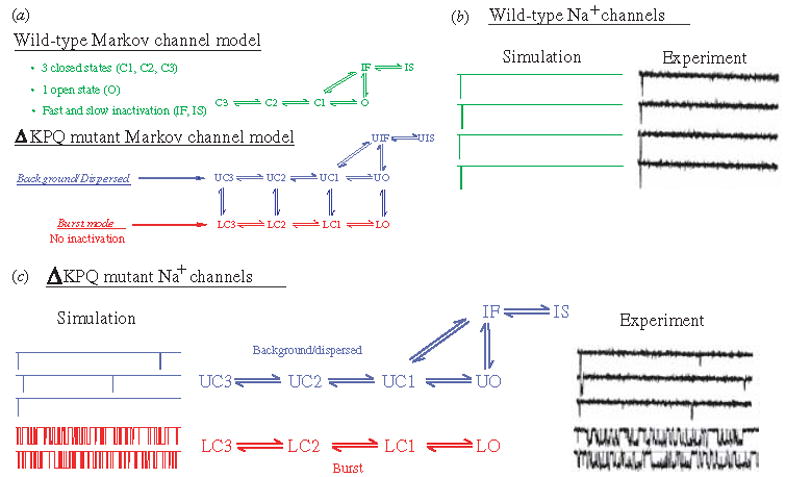
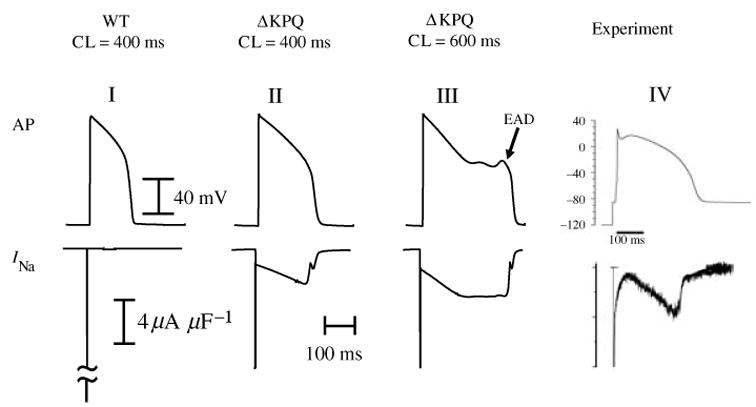
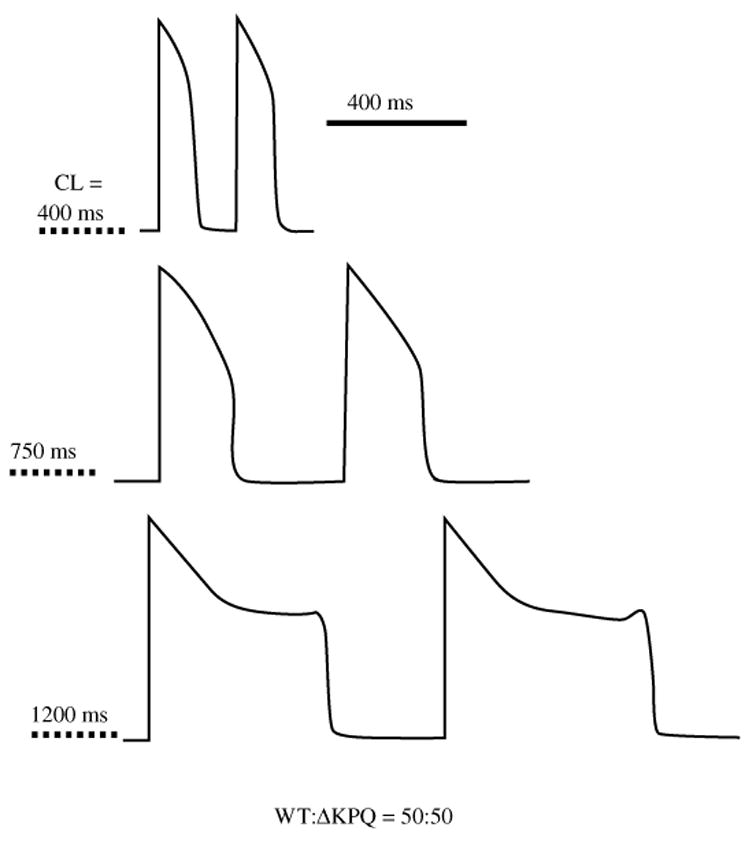
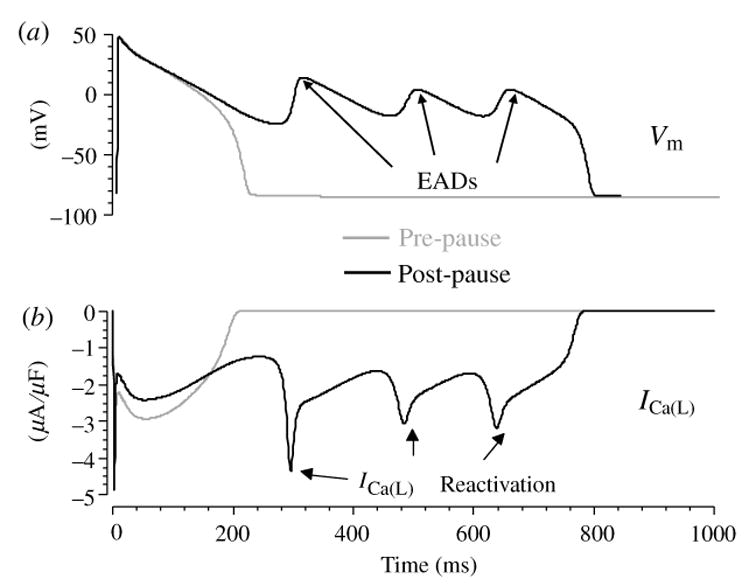
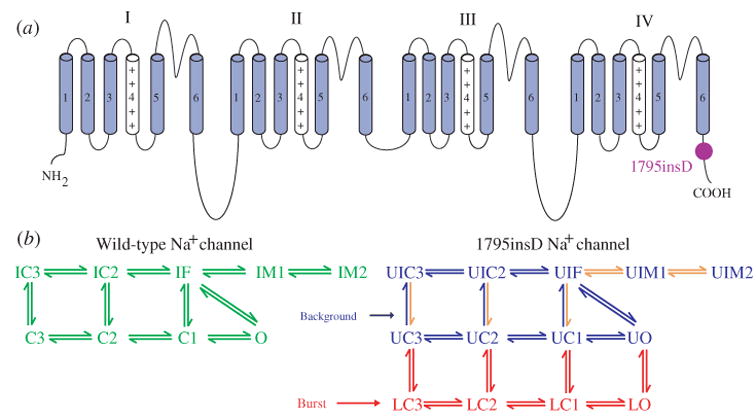
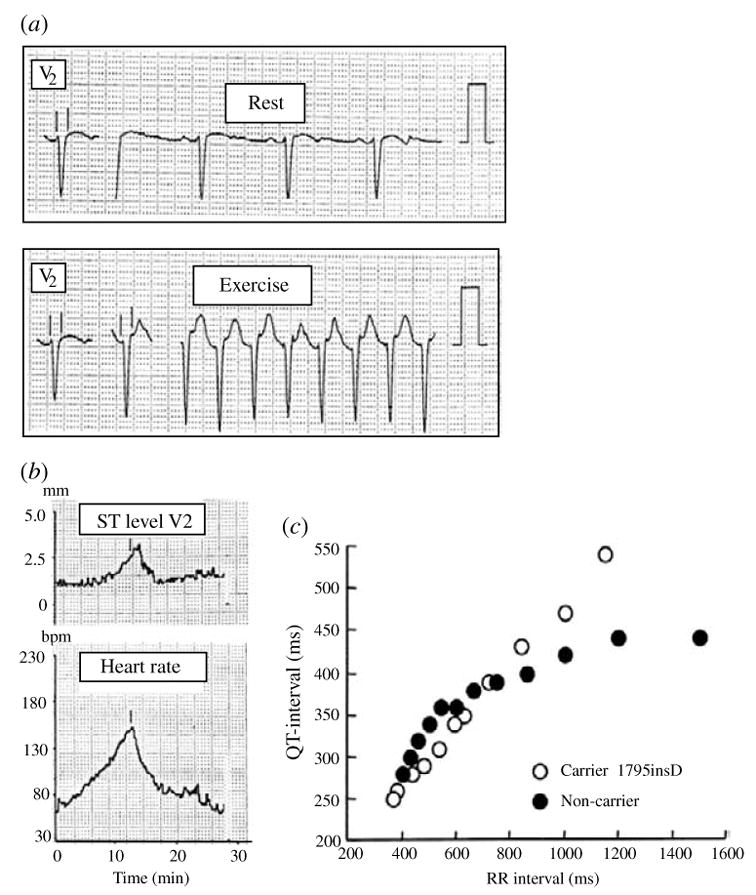
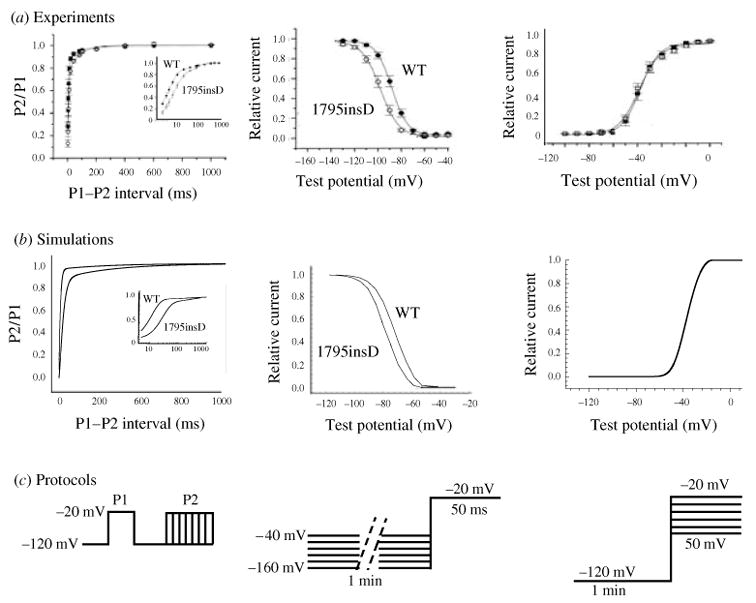
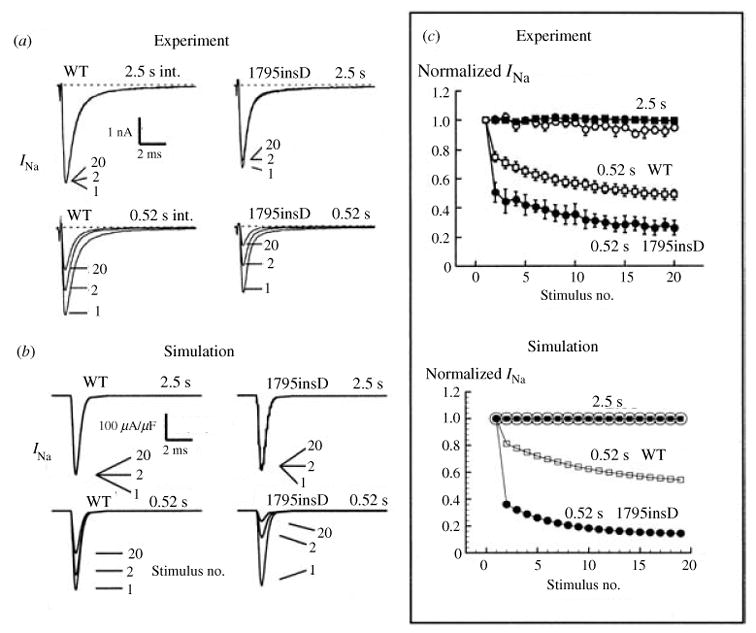
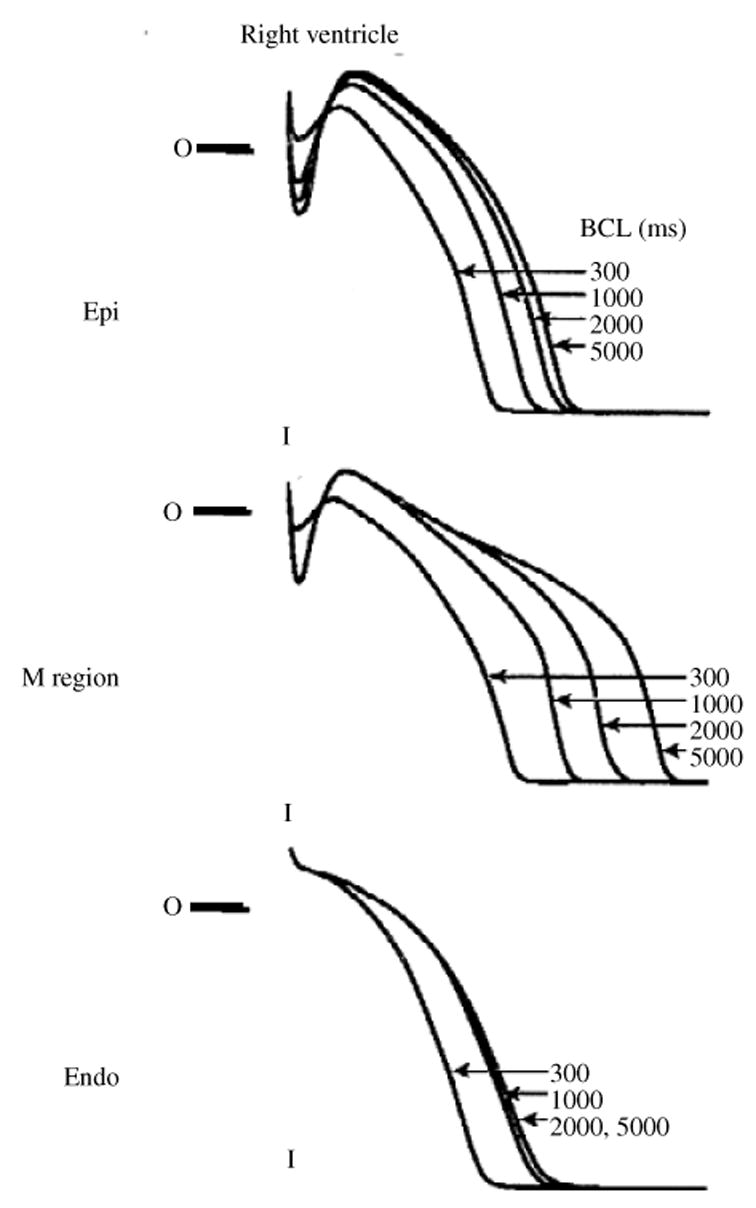
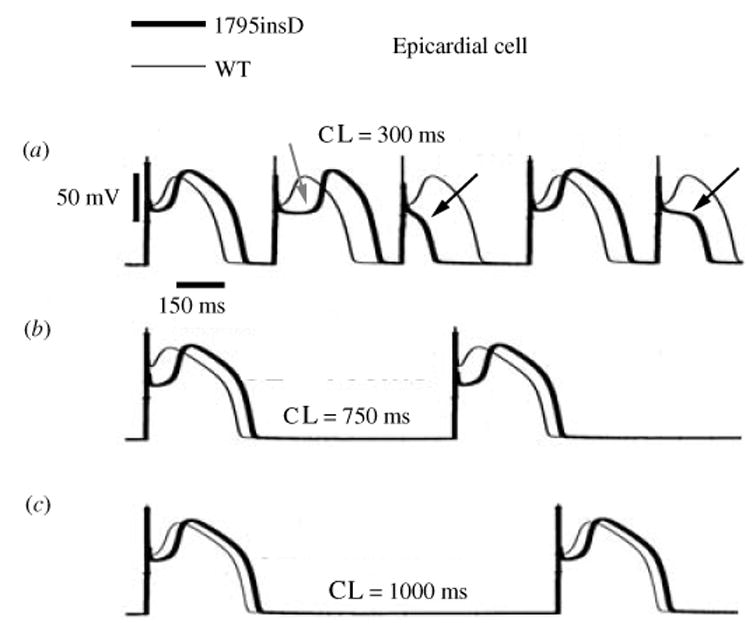
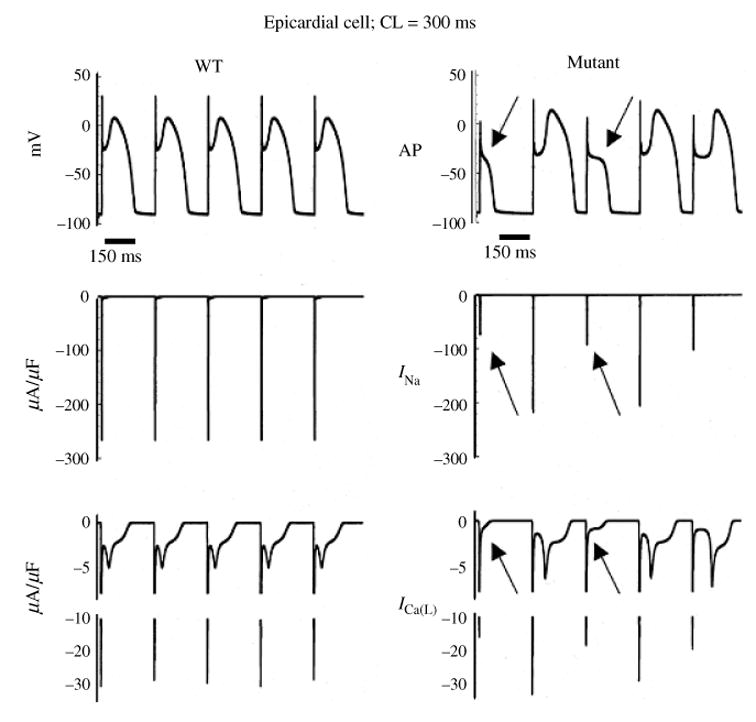
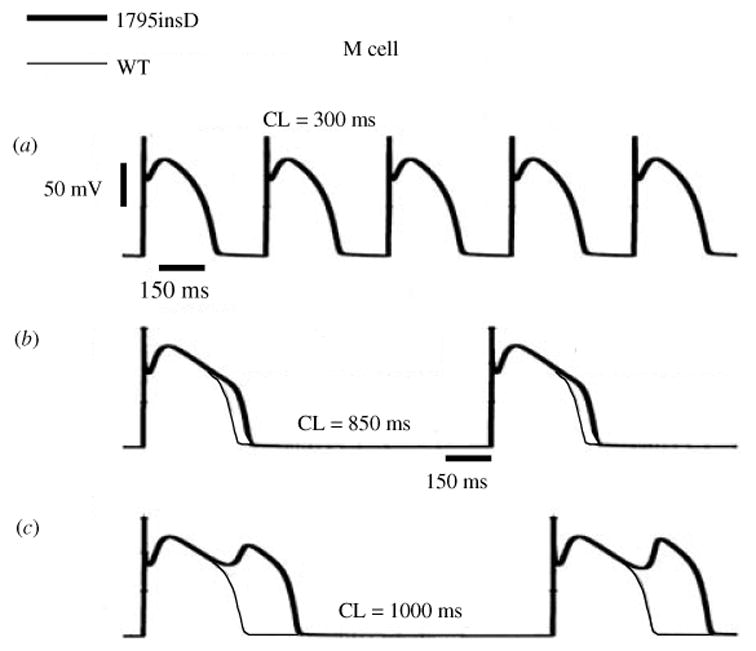
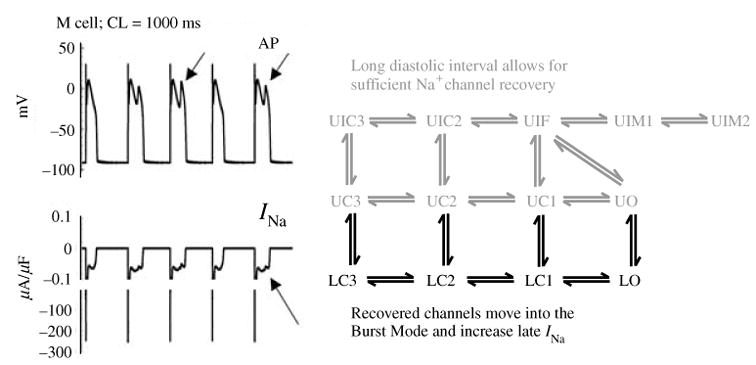
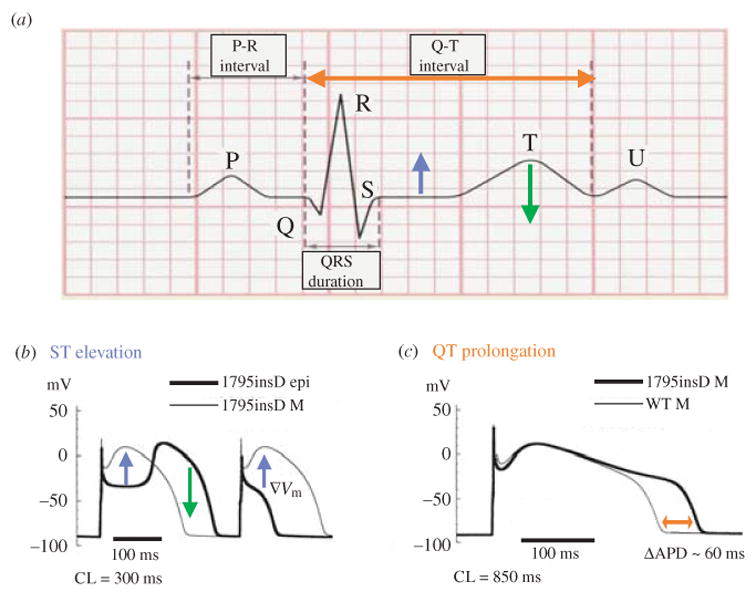
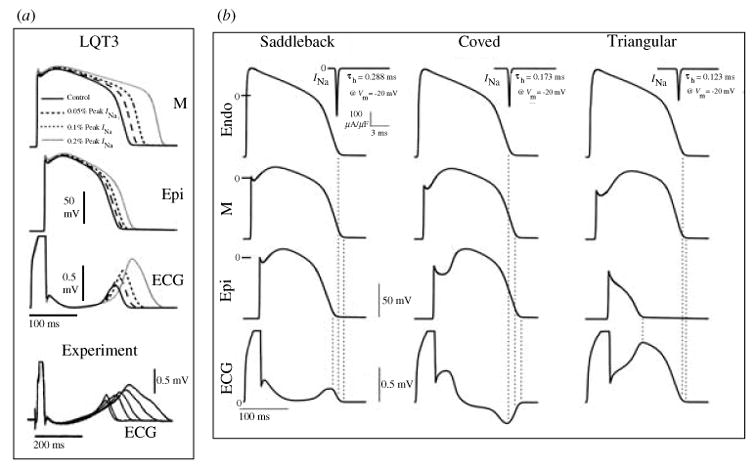
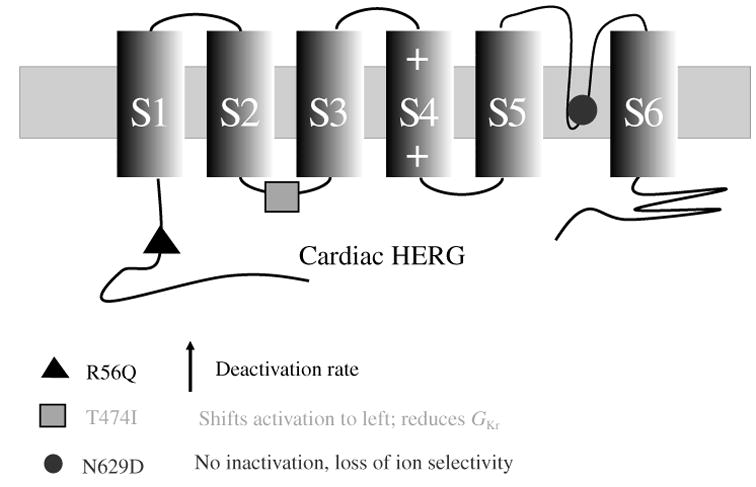
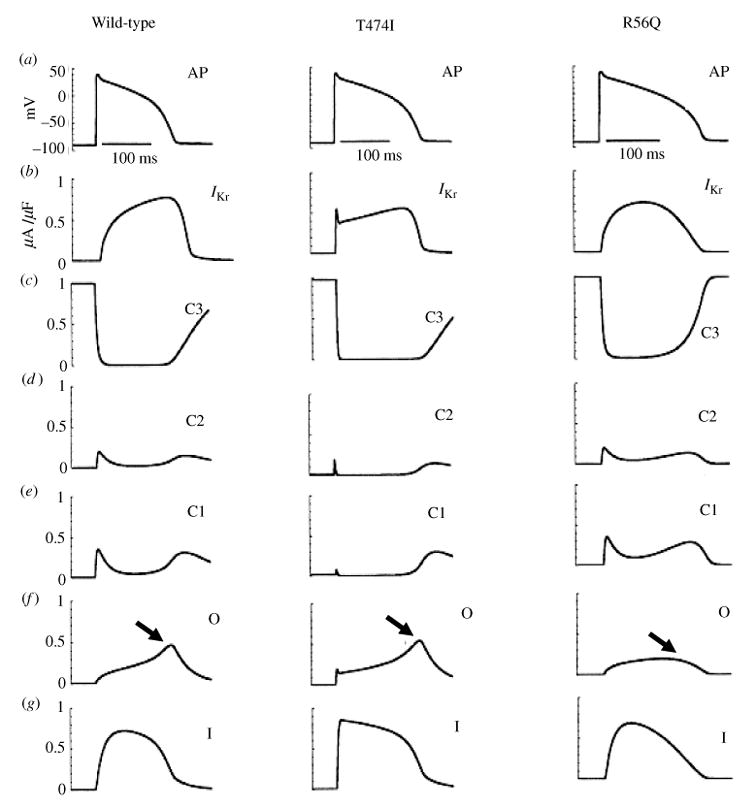
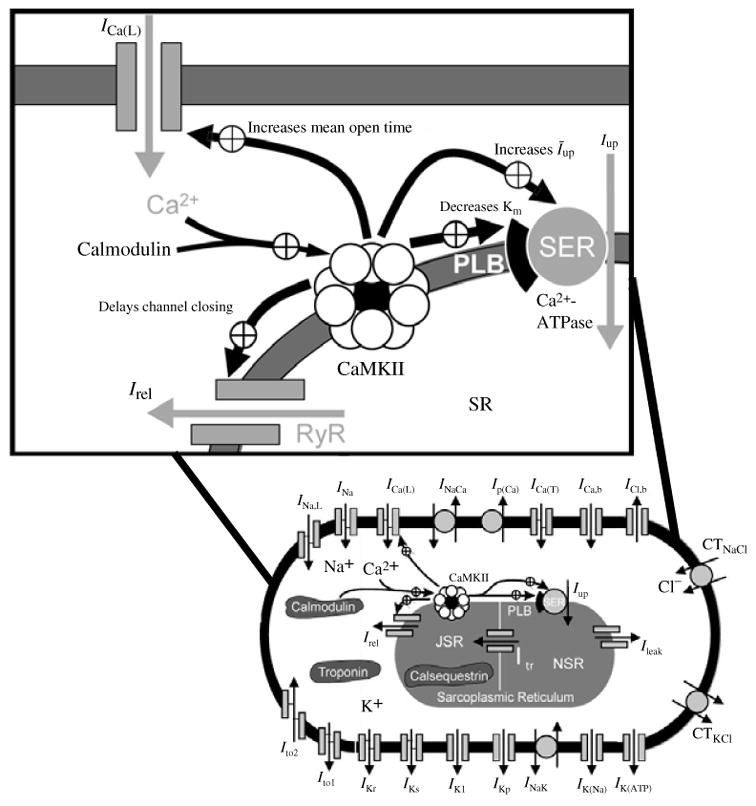
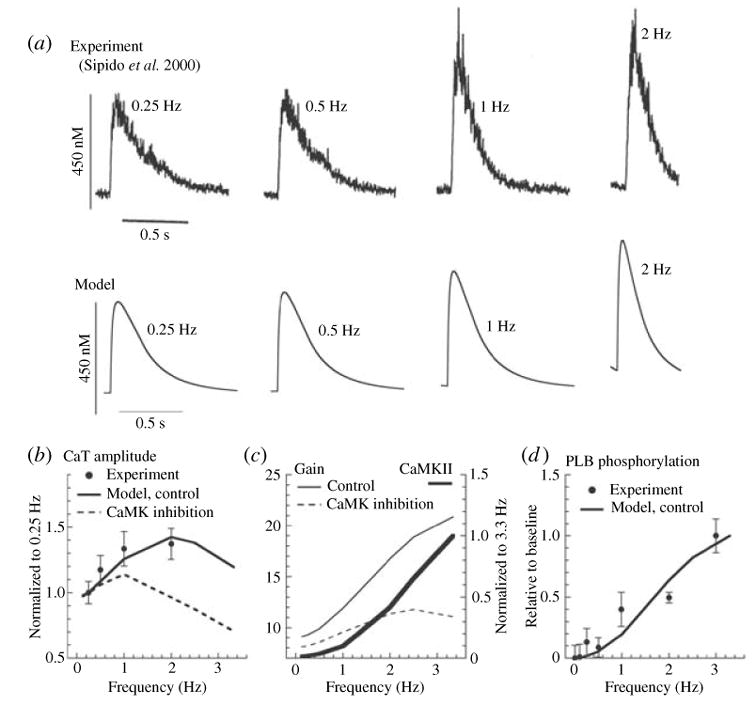
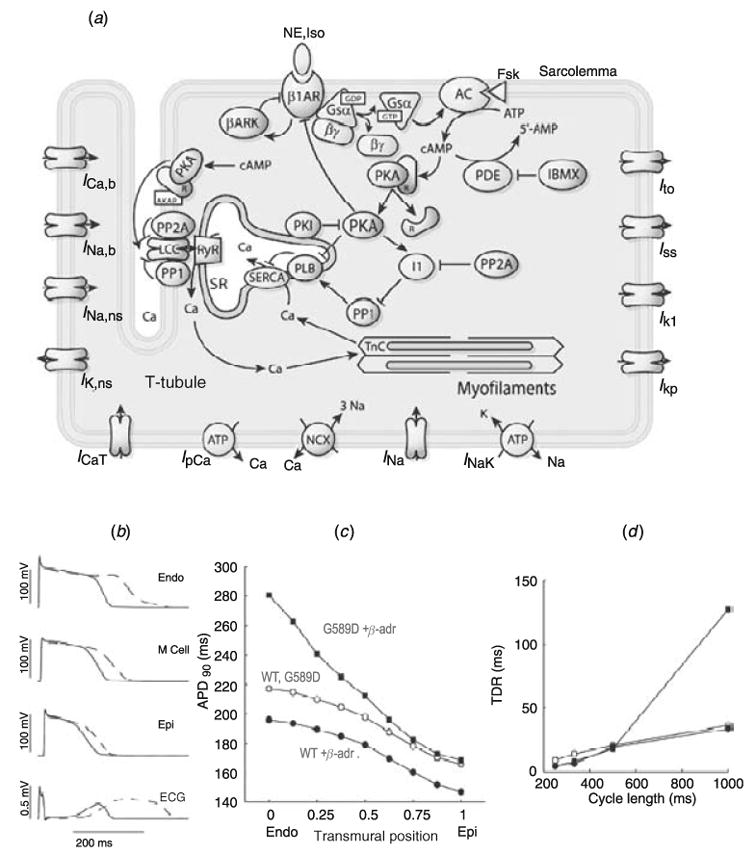
The cardiac cell is a complex biological system where various processes interact to generate electrical excitation (the action potential, AP) and contraction. During AP generation, membrane ion channels interact nonlinearly with dynamically changing ionic concentrations and varying transmembrane voltage, and are subject to regulatory processes. In recent years, a large body of knowledge has accumulated on the molecular structure of cardiac ion channels, their function, and their modification by genetic mutations that are associated with cardiac arrhythmias and sudden death. However, ion channels are typically studied in isolation (in expression systems or isolated membrane patches), away from the physiological environment of the cell where they interact to generate the AP. A major challenge remains the integration of ion-channel properties into the functioning, complex and highly interactive cell system, with the objective to relate molecular-level processes and their modification by disease to whole-cell function and clinical phenotype. In this article we describe how computational biology can be used to achieve such integration. We explain how mathematical (Markov) models of ion-channel kinetics are incorporated into integrated models of cardiac cells to compute the AP. We provide examples of mathematical (computer) simulations of physiological and pathological phenomena, including AP adaptation to changes in heart rate, genetic mutations in SCN5A and HERG genes that are associated with fatal cardiac arrhythmias, and effects of the CaMKII regulatory pathway and beta-adrenergic cascade on the cell electrophysiological function.


Figures

Fig. 1
Fig. 1
(a) Circuit diagram of the Hodgkin–Huxley membrane model. Two voltage-dependent conductances (gNa, sodium and gK, potassium) and one voltage-independent conductance ( gL¯) in parallel with a capacitor describe the electrical properties of the membrane. The driving force for each current is the difference between the transmembrane potential, Vm, and the equilibrium potential, E, for the charge-carrying ion, for example, the driving force for INa is (VmENa). The equilibrium potential is calculated with the Nernst equation. (b, c). Voltage and time dependence of ionic conductances; comparison of the Hodgkin–Huxley model with experiment. (b) Model-simulated sodium conductance, gNa (solid line) is superimposed on experimental data (open circles). Vm values (mV) are indicated by numbers on each trace; conductance scales (mMho/cm2) are provided on the right. (c) Same as (b) for potassium conductance, gK. Vm values (mV) are indicated by numbers above tracings and conductance scales (mMho/cm2) are on the left. (From Hodgkin & Huxley, 1952, with permission.)
Fig. 2
Fig. 2
A schematic of the Luo–Rudy dynamic (LRd) ventricular cell model. The model is based mostly on data from the guinea pig. Dynamics of intracellular Na+, K+, and Ca2+ are accounted for in the model. Dynamic changes of intracellular Ca2+ are determined by transmembrane fluxes, release and uptake by a two compartment sarcoplasmic reticulum (SR), and Ca2+ interactions with buffers. Boxed ionic currents are simulated with recently published Markov formulations (other currents follow the Hodgkin–Huxley formulation). Definitions: INa, fast sodium current; ICa(L), calcium current through L-type calcium channels; ICa(T), calcium current through T-type calcium channels (Droogmans & Nilius, 1989; Balke et al. 1992; Vassort & Alvarez, 1994); IKr, rapid delayed rectifier potassium current (Clancy & Rudy, 2001; Silva & Rudy, 2005); IKs, slow delayed rectifier potassium current (Silva & Rudy, 2005); IK1, inward rectifier potassium current (Kurachi, 1985); IKp, plateau potassium current (Yue & Marban, 1988; Backx & Marban, 1993); INa,b, sodium background current; ICa,b, calcium background current; INaK, sodium–potassium pump current; INaCa, sodium–calcium exchange current; Ip(Ca) calcium pump in the sarcolemma (Caroni et al. 1983); Iup, calcium uptake from the myoplasm to network sarcoplasmic reticulum (NSR) (Tada et al. 1989); Irel, calcium release from junctional sarcoplasmic reticulum ( JSR) (Meissner, 1995); Ileak, calcium leakage from NSR to myoplasm; Itr, calcium translocation from NSR to JSR (Yue et al. 1985). The following currents (shaded in the figure) are included under pathological conditions: IK(ATP), ATP-sensitive potassium current, activated under conditions of ATP depletion (ischemia) (Kakei et al. 1985; Nichols et al. 1991; Noma, 1983; Shaw & Rudy, 1997a); IK(Na), sodium-activated potassium current, activated under conditions of sodium overload (Kameyama et al. 1984; Luk & Carmeliet, 1990; Wang et al. 1991; Faber & Rudy, 2000); Ins(Ca), non-specific calcium-activated current, activated under conditions of calcium overload (Ehara et al. 1988; Luo & Rudy, 1994b); Calmodulin and troponin represent calcium buffers in the myoplasm. Calsequestrin is a calcium buffer in the JSR. Ito the transient outward current is not present in guinea pig ventricular myocytes; it is included in certain simulations that examine its possible effects on the AP (Dumaine et al. 1999). Details of the LRd model can be found in the literature (Luo & Rudy, 1991; Luo & Rudy, 1994a; Zeng et al. 1995; Shaw & Rudy, 1997b; Viswanathan & Rudy, 1999; Viswanathan et al. 1999; Faber & Rudy, 2000; Hund et al. 2001; Rudy, 2002) and at http://rudylab.wustl.edu where the model code is also provided. (b)–(e). Stability of dynamic cell models (‘second-generation models’); effect of stimulus charge carrier. (b) Vm during the diastolic interval (Vm,dia); (c) action potential duration (APD); (d) [Na+]i, and (e) [K+]i as a function of time during pacing with a current stimulus at a cycle length (CL) of 300 ms using the algebraic method (solid line) and the differential method (dashed line indicated with arrow); note that the two are indistinguishable. In both cases, the stimulus current carries K+ ions into the cell and contributes directly to computed changes in intracellular ion concentrations. Note the stability (lack of drift) and identical results for both methods. An additional simulation is shown using the differential method and a current stimulus formulation that does not account for the charge carrying ion species (dash-dot line). Notice that computed parameters drift if ions carried by the stimulus current are not taken into account in the computation of ion concentration changes, which violates conservation laws. (From Hund et al. 2001, with permission.)
Fig. 3
Fig. 3
Archetypal Na+ and K+ channel subunits. (a) The homomeric Na+ channel is typically composed of a single four-domain α-subunit. Each domain consists of six transmembrane spanning segments (S1–S6). The fourth segment (S4) contains positively charged amino acids that confer voltage sensitivity on the channel. The S5–S6 linker forms a hairpin that enters the membrane to partially form the channel pore (P-loop), and determines ion selectivity. Several amino acids in the III–IV linker (labeled) have been linked to sodium channel fast inactivation. (b) Homomeric K+ channels are typically composed of four identical α-subunits. Each subunit bears some functional resemblance to the domains of the Na+ channel.
Fig. 4
Fig. 4
Examples of Markov and equivalent Hodgkin–Huxley (HH) models of ionic currents. (a) A two-state closed (C) – open (O) model with α and β as forward and reverse transition rates. In the equivalent HH-type formulation, current activation is described by a single gating variable, such as m. (b) A four-state model with two independent transitions. C, Closed; O, open; IC, closed-inactivated IO, open-inactivated. The transition rates α, β between IC and IO and between C and O are identical, as are transition rates γ, δ between C and IC and between O and IO. Thus activation and inactivation transitions are independent in this model. Independent transitions are readily modeled using the HH formulation. The probability for current activation is m and the probability that it is not inactivated is h; the open probability is m · h. (c) A three-state model with dependent transitions from C to O and O to I. There is no HH equivalent because of the dependent transitions. (d) K+ channels have four identical subunits, suggesting four independent identical transitions to the activated state. When all subunits are activated, the channel is open. Assigning an activation gate n, the probability of all four subunits being in the activated position, and thus the probability of the channel being open, is n4. (e) Biophysical analysis has shown that each of the four voltage sensors in certain K+ channels undergoes two transitions before channel opening. A model describing this gating property is shown; R1 is the rest state, R2 is an intermediate state, and A is the activated state. The channel is open when all four sensors are in the activated (A) position. Because transitions from R2 to A depend on transitions from R1 to R2, a HH analog of the Markov model does not exist.
Fig. 5
Fig. 5
Conformational changes of K+ channels during activation. (a) Structural basis for two voltage-sensor transitions before channel opening (modified from Silverman et al. 2003, with permission). (b) Kinetic representation of the two voltage-sensor transitions in panel (a); all four α-subunits that form the channel undergo a first transition from a resting state (R1) to an intermediate state (R2) and a second transition from R2 to an activated state (A). Once all voltage sensors are in the activated state, the channel can open. (c) Total number of combinations of voltage-sensor positions in the four subunits is 15 and can be represented by 15 closed states before channel opening. Blue, red, green indicate a voltage sensor in position R1, R2 or A, respectively. (From Rudy, 2006, with permission.) Panel (a) is based on data from ether-à-go-go (eag) and Shaker K+ channels and is adapted from Silverman et al. 2003, with permission.
Fig. 6
Fig. 6
Kinetic transitions of Na+ channels during the AP at slow and fast rate. (a) Markov model of the Na+ channel (Clancy & Rudy, 2002). States are color coded according to their type: closed-inactivated (gray), fast-inactivated (purple), slow inactivated (green), closed (blue), open (red). (b) INa, Vm and channel state occupancies during first 3 ms of the 40th AP at slow rate, CL = 1000 ms. The channel state occupancies during the same time period (bottom panel) show a rapid transition out of the closed states into the open state. The time required for inactivation after channel opening determines peak INa = –270 μA/μF. While Vm remains at depolarized potentials, channels enter the slow inactivated states. At slow rate, few channels are inactivated at the initiation of the AP. (c) INa, Vm and channel state occupancies during first 3 ms of the 40th AP at fast rate, CL = 300 ms. Accumulation of channels in the slow inactivated states (green) at fast rate results in reduction of INa during the upstroke and consequently a slower dVm/dtmax.
Fig. 7
Fig. 7
Kinetic transitions of IKr channels during the AP at slow and fast rate. (a) Markov model of the IKr channel (Clancy & Rudy, 2001; Silva & Rudy, 2005). States are color coded according to their type: closed (blue), inactivated (purple), open (red). (b) IKr, Vm, and channel state occupancies during the 40th AP at slow rate, CL = 1000 ms. Even though IKr activates nearly instantaneously, few channels move into the open state because of rapid inactivation. Then, as Vm decreases, channels begin to recover from inactivation generating a pronounced peak of open-state occupancy and peak current during the late phase of the AP. (c) IKr, Vm, and channel state occupancies during the 40th AP at fast rate, CL = 300 ms. Surprisingly, peak IKr is not changed significantly at fast rate. Examination of the state occupancies (bottom panel) reveals that conditions at AP initiation are identical at fast and slow rates, preventing any current accumulation. However, faster increase of IKr at fast rate during the AP contributes to APD shortening.
Fig. 8
Fig. 8
Kinetic transitions of IKs channels during the AP at slow and fast rate. (a) Markov model of the IKs channel (Silva & Rudy, 2005). States are color coded according to their type: zone 2, closed states for which not all voltage sensors have completed the first transition (light green). zone 1, closed states for which all four voltage sensors have completed the first transition (blue). Open (red). (b) IKs, Vm and channel state occupancies during the 40th AP at slow rate, CL = 1000 ms. IKs rises slowly, resulting in peak current at the end of the AP where it most efficiently contributes to repolarization. Only 40% of channels reside in zone 1 at AP onset and can activate rapidly. While Vm remains depolarized, channels continue to transition from zone 2 to zone 1. (c) IKs, Vm, and channel state occupancies during the 40th AP at fast rate, CL = 300 ms. Since the diastolic interval is shorter at CL = 300 ms, Vm stays at depolarized potentials for a larger percentage of time, which causes accumulation in zone 1 of closed states. At AP onset 75% of channels reside in zone 1, facilitating rapid transitions to the open state. This results in increased IKs late during the AP and APD shortening. Note that the mechanism for IKs increase is accumulation in closed states near the open state (zone 1) as opposed to open-state accumulation. The accumulation in zone 1 creates a reserve of channels that are ready to open rapidly, ‘on demand’ to generate a greater repolarizing current; we call this pool of channels ‘available reserve’.
Fig. 9
Fig. 9
APD rate-rdaptation with human IKs vs. human KCNQ1. (a) 40th AP computed with human IKs in the cell model at CL = 250 ms (thin line) and CL = 1000 ms (thick line). (b) Same as panel (a) with KCNQ1 replacing IKs in the model. (c) Human IKs during the AP at fast and slow rates. Some open-state accumulation at fast rate causes a small instantaneous current upon depolarization (arrow), while closed-state accumulation in zone 1 [see panel (e) and Fig. 10c] creates a reserve that allows the current to increase to a late peak that shortens APD effectively. (d ) KCNQ1 during the AP at fast and slow rate. Slow kinetics of deactivation cause large open- state accumulation at fast rate and large instantaneous current upon depolarization (arrow). Note that in the absence of zone 1 reserve [see panel (e)], the current stays constant during the AP, lacking the late, repolarizing peak of IKs. (e) Human IKs (black) and KCNQ1 (gray) zone 1 occupancy at CL = 250 ms and 1000 ms. Accumulation in zone 1 at fast rate allows IKs to participate in adaptation. In contrast, little accumulation is seen in zone 1 for KCNQ1. ΔZone 1 is increase in zone 1 occupancy between CL = 1000 ms and 250 ms. (f) APD adaptation curves for an AP with human IKs (solid line) and KCNQ1 (dashed line). Lack of accumulation in zone 1 results in less APD shortening at fast rates with KCNQ1 compared to IKs. (From Silva & Rudy, 2005, with permission.)
Fig. 10
Fig. 10
Role of selected ion-currents in APD rate-adaptation in the canine and the guinea pig. Simulations conducted with HRd canine (Hund & Rudy, 2004) (left panels) and LRd guinea pig (Luo & Rudy, 1994a) (right panels) cell models. Steady-state values are shown at fast rate (CL = 300 ms, thin line) and slow rate (CL = 2000 ms, thick line). (a) AP; (b), ICa(L); (c), IKs (arrow indicates IKs accumulation); (d ), IKr. Schematic of the HRd model is provided in Fig. 31. (From Hund & Rudy, 2004, with permission.)
Fig. 11
Fig. 11
The excitatory cycle of an ion channel and its alteration by the ΔKPQ deletion mutation of the Na+ channel. (a)–(e) Schematic description of ion-channel transitions during the action potential. Because of the ΔKPQ structural defect in the III–IV linker, the ‘hinged-lid’ mechanism of inactivation fails to plug the channel pore in some channels, some of the time. Thus, ΔKPQ mutant channels experience a transient failure of inactivation [panel (e)]. The boxed panel shows the mutant channel, where three amino acids, Lys1505 (K), Pro1506 (P) and Gln1507 (Q) are deleted from the III–IV linker which participates in fast inactivation.
Fig. 12
Fig. 12
(a) Markov models of the wild-type (WT) and ΔKPQ mutant Na+ channels. The WT channel (top, green) contains three closed states, an open (conducting) state, and fast and slow inactivated states. The ΔKPQ channel has two modes of gating : the background (or dispersed) mode (blue) that is similar in structure to WT, and a burst mode (red) in which channels fail to inactivate. The U and L prefixes to ΔKPQ states indicate upper mode and lower mode, respectively. (Modified from Clancy & Rudy, 1999, with permission.) (b, c) WT and ΔKPQ single-channel gating. (b) Simulated WT channels (left) show only single openings in response to depolarization, as observed experimentally by Chandra et al (right). (c) Simulated ΔKPQ channels in the background mode (left, blue) show secondary reopenings beyond the first opening. In the burst mode (red), channels do not inactivate and fluctuate between open and closed states. Similar behavior is observed experimentally. (Modified from Clancy & Rudy, 1999; experimental data are reproduced from Chandra et al. 1998, with permission.)
Fig. 13
Fig. 13
Effect of ΔKPQ mutation on the whole-cell AP. Simulated AP is shown on top and corresponding INa on the bottom. ΔKPQ INa generates a persistent current during the AP plateau that prolongs APD (II) relative to WT (I). As pacing rate is decreased, persistent INa increases causing greater prolongation of APD and generation of EADs (III). Panel IV shows experimental AP-clamp mutant data from Wang et al. (1997); note the similar morphology of persistent INa to that simulated in panel II. (From Clancy & Rudy, 1999; experimental data are reproduced from Wang et al. 1997, with permission.)
Fig. 14
Fig. 14
Effect of ΔKPQ at various pacing cycle lengths (CL). The cell contains equal densities of WT and mutant channels (50%/50%). As pacing rate decreases, APD prolongation becomes more pronounced. At a bradycardia CL of 1200 ms, EADs develop. (From Clancy & Rudy, 1999, with permission.)
Fig. 15
Fig. 15
Ionic mechanism of plateau EADs. (a) Pre-pause (gray) and post-pause (black) APs. (b) The corresponding ICa(L) during the AP. Reactivation of ICa(L) [(b), arrows] depolarizes the membrane to generate the EADs [(a), arrows]. (Modified from Viswanathan & Rudy, 1999, with permission.)
Fig. 16
Fig. 16
Markov models of WT and 1795insD mutant Na+ channels. (a) Location of the aspartic acid insertion in the C terminus of the 1795insD mutant channel protein. (b) The WT Markov model (left, green) and the 1795insD Markov model (right) with its background mode (blue) and burst mode (red). Orange arrows indicate transitions with rate modified by the mutation (e.g. slower recovery from IC3 to C3; see text). IM1 and IM2 are intermediate inactivation states. (Modified from Clancy & Rudy, 2002, with permission.)
Fig. 17
Fig. 17
Clinical data from patients with the 1795insD mutation. (a) ST-segment elevation at fast heart rate (Exercise, bottom) compared to control (Rest, top) in lead V2 of the ECG. (b) Indicates that the ST-segment elevation (top) increases with heart rate (bottom). (c) Indicates much greater QT prolongation in mutation carriers (○) compared to non-carriers (●) as heart rate decreases. (From Veldkamp et al. 2000, with permission.)
Fig. 18
Fig. 18
Properties of WT and 1795insD mutant INa current. (a) Experimental data from Veldkamp et al. (2000). (b) Simulations of the experimental protocols. (c) Diagrams illustrating the protocols. Voltage dependence of activation (right) is indistinguishable between WT and mutant. Channel availability curve (middle) is shifted to the left by the mutation because of increased absorbency of inactivation states; thus, at any given voltage, channel availability is reduced. Mutant channels recover slower from inactivation (left); on an expanded log scale (inset) it is evident that recovery time could be as long as 100 ms, which is on a timescale of the AP duration. (From Clancy & Rudy, 2002; experimental data are reproduced from Veldkamp et al. 2000, with permission.)
Fig. 19
Fig. 19
The 1795insD mutation causes rate-dependent reduction of INa. A train of 500 ms depolarizing pulses are applied at slow (2·5 s interval) or fast (0·52 s interval) rate. (a) INa for WT (left) and mutant (right) channels at these slow (top) and fast (bottom) rates. At fast rate there is progressive (cumulative) loss of INa from stimulus 1 to stimulus 2 to stimulus 20. (b) Results of the corresponding simulation. (c) Summary of the results of panels (a) and (b) indicating normalized peak INa for 20 stimuli during the same protocol. At slow rate (2·5 s), there is no loss of current. At fast rate (0·25 s) the mutant loss is greater than WT. Experiment (top) and simulation (bottom) show similar behavior. (From Clancy & Rudy, 2002; experimental data are reproduced from Veldkamp et al. 2000.)
Fig. 20
Fig. 20
AP of different right ventricular cell types. Epicardial cells (top) show a distinct ‘spike and dome’ morphology of the AP, with a deep notch separating spike from dome. M cells from the mid-myocardium (middle) typically have a more shallow notch; their Ito and IKs densities are lower than those of epicardial cells and as a result their AP repolarization phase is easily perturbed by mutations or drugs, or by changes of pacing rate (shown in the figure). Endocardial cells (bottom) do not express Ito and their AP does not display a notch. (From Sicouri & Antzelevitch, 1991, with permission.)
Fig. 21
Fig. 21
Rate-dependent effect of 1795insD on epicardial cell AP. At fast pacing (a) the AP morphology alternates between ‘loss of dome’ (black arrows) and a prolonged notch (‘coved dome’, gray arrow). At intermediate rate (b) the AP has a coved-dome morphology on every beat. At slow rate (c ) WT and mutant AP morphologies are similar. (From Clancy & Rudy, 2002, with permission.)
Fig. 22
Fig. 22
Mechanism of 1795insD effect on AP of epicardial cell during fast pacing. APs are shown on top, with corresponding INa and ICa(L) in middle and bottom panels, respectively. For WT channels ( left) INa is fully recovered between beats. ICa(L) develops its plateau phase, and the AP is normal on every beat. For mutant channels (right) cumulative loss of INa (arrows in middle panel) causes premature repolarization, loss of plateau ICa(L) (arrows in bottom panel) and loss of the AP dome (arrows in top panel). For some beats (e.g. last AP shown) the INa loss is not sufficient to cause a complete loss of the dome and the notch is greatly prolonged. (From Clancy & Rudy, 2002, with permission.)
Fig. 23
Fig. 23
Rate-dependent effect of 1795insD on M cell AP. At fast rate (a) the WT and mutant APs are indistinguishable. At a rate of CL = 850 ms (b) mutant AP is prolonged relative to WT. At slow rate (c) of CL = 1000 ms, mutant APD is greatly prolonged and arrhythmogenic EADs develop. (From Clancy & Rudy, 2002, with permission.)
Fig. 24
Fig. 24
Mechanism of 1795insD effect on AP of M cell during slow pacing. Left: mutant APs are shown on top, with corresponding INa on bottom. Mutant INa generates current during the AP plateau (bottom arrow) that prolongs the APD and results in EAD formation (top arrows). Right: the INa Markov model identifies the processes that lead to late INa during the AP plateau. At slow rate, there is sufficient time between beats for channels to recover from inactivation into the closed and open states of the background mode (gray). From these states, they can transition into the burst mode (black) to generate late INa. (From Clancy & Rudy, 2002, with permission.)
Fig. 25
Fig. 25
Mechanisms of ECG changes caused by the 1795insD mutation. (a) Stylized ECG defining the different deflections, waves and intervals. (b) Cellular mechanism of ST elevation and T-wave inversion. At fast rate, loss of dome or coved dome in epicardial cells creates a voltage gradient (▽Vm, blue arrows) between these cells (bold line) and M cells (thin line) during the AP plateau, leading to ST-segment elevation on the ECG [blue arrow in (a)]. Greatly prolonged notch in a coved-dome epicardial AP could delay its repolarization beyond that of M cell, thus reversing the normal gradient (normally, M cells have the longest APD and repolarize last) as indicated by the green arrow in (b), possibly leading to T-wave inversion [green arrow in (a)]. (c) Cellular mechanism of QT prolongation. At slow rate M-cell APD is prolonged by the mutation (red arrow). The delayed repolarization is reflected as QT prolongation on the ECG [red arrow in (a)]. [Simulation data in (b) and (c) are reproduced from Clancy & Rudy, 2002, with permission.]
Fig. 26
Fig. 26
Simulations of ECG changes in LQT3 and Brugada syndromes. The simulations were conducted in a 1-dimensional fiber containing regions of epicardial (Epi), endocardial (Endo) and M cells. The different cell types AP and ECG are shown. (a) LQT3 is simulated, with increasing severity, by incorporating a late INa component with magnitude of 0.05%, 0.1%, and 0.2% of peak INa. APD prolongation increases with increasing severity and M cell APD prolongs more than epicardial APD, increasing dispersion of repolarization. These AP changes are reflected as QT prolongation and T-wave widening in the ECG. These simulation results are consistent with experimental data of Shimizu & Antzelevitch, 1997 recorded in a transmural wedge preparation (shown in the bottom panel). (b) Brugada syndrome at increasing severity is simulated by accelerating fast inactivation of INa (progressively decreasing its time constant, τh, from left to right). For all degrees of severity, ST-segment elevation is observed on the ECG, with typical ‘saddleback’, ‘coved’, and ‘ triangular ’ morphologies as severity increases. (From Gima & Rudy, 2002; experimental data in panel (a) are reproduced from Shimizu & Antzelevitch, 1997, with permission.)
Fig. 27
Fig. 27
HERG mutations. Structure of cardiac HERG showing locations of mutations simulated in this study. Kinetic changes caused by the mutations are summarized below the diagram. For Markov model of IKr see Fig. 7a (Clancy & Rudy, 2001; Silva & Rudy, 2005).
Fig. 28
Fig. 28
Effects of HERG mutations on the AP. (a) The AP (1000th paced beat) at a cycle length (CL)=750 ms. (b) Denotes IKr during the AP. (c)–(g) The probabilities of residence in the indicated channel states over the course of the AP. Left column: wild-type; middle column: T474I mutation; right column: R56Q mutation. (From Clancy & Rudy, 2001, with permission.)
Fig. 29
Fig. 29
Simulation of HERG N629D mutation. AP and IKr during the AP are shown for (a) epicardial cell and (b) M cell. (Adapted from Clancy & Rudy, 2001, with permission.)
Fig. 30
Fig. 30
IKs as repolarization reserve. (a) Mean IKs during the AP (black) accumulates during pacing, showing significant increase over 40 paced APs. In contrast, KCNQ1 shows only a small increase. When IKr is blocked (right bars) IKs increases further, providing a compensating repolarizing current. (b) When IKr is blocked, a post-pause AP develops an EAD with KCNQ1 (gray) but not with IKs (black). (From Silva & Rudy, 2005, with permission.)
Fig. 31
Fig. 31
CaMKII pathway incorporated into a canine ventricular cell model. Bottom: cell model containing the CaMKII pathway. Top: a detailed view of the CaMKII pathway and substrates. Upon Ca2+ binding, CaMKII phosphorylates ICa(L), Irel (the ryanodine receptor, RyR), SERCA2a (SR Ca2+-ATPase; SER in the figure), and phospholamban (PLB). PLB phosphorylation relieves inhibition of SERCA2a Ca2+ uptake. Autophosphorylation of CaMKII is also represented in the model, a property which enables detection of Ca2+ spike frequency. The model includes a calcium subspace where ICa(L) and Irel interact. It also includes Ito,2, an inward chloride current, and intracellular Cl regulation by the Na+-dependent Cl co-transporter CTNaCl and the K+-Cl co-transporter CTKCl. (Modified from Hund & Rudy, 2004, with permission.)
Fig. 32
Fig. 32
CaMKII regulation of the Ca2+-transient rate-dependence. (a) Simulated (bottom) and measured (top) steady-state Ca2+ transient (CaT) for 0.25, 0.5, 1, and 2 Hz pacing. (Experimental tracings are adapted from Sipido et al. 2000, with permission.) (b) CaT-frequency relation for experiment (circles), model under control conditions (line), and in presence of CaMKII inhibition (dashed line). (c) Minimal diastolic CaMKII activity (thick line, normalized to 3.3 Hz) and excitation-contraction coupling (ECC) gain. ECC gain=∫A Freldt/∫A FCa(L)dt, where Frel and FCa(L) are fluxes through RyR and ICa(L), respectively, and the integration interval, A, is over one cycle. Gain is shown for control model (thin line) and in presence of CaMKII inhibition (dashed line). (d ) PLB phosphorylation vs. pacing frequency compared with experimental data (Hagemann et al. 2000). (From Hund & Rudy, 2004, with permission.)
Fig. 33
Fig. 33
(a) Schematic of the β-adrenergic network and signaling mechanisms in the model of Saucerman et al. (2003). Schematic of integrated model components, including the β1-adrenergic network, calcium handling, and electrophysiology; β-adrenergic model is based on data from rat, while electrophysiology data are from rabbit. NE, norepinephrine; Iso, isoproterenol; β1AR, β1-adrenergic receptor; βARK, β-adrenergic receptor kinase; AC, adenylyl cyclase; Fsk, forskolin; PDE, phosphodiesterase; PKA, protein kinase A; PKI, heat-stable protein kinase inhibitor; PP1, protein phosphatase-1; PP2A, protein phosphatase-2A; I1, protein phosphatase inhibitor-1; PLB, phospholamban; LCC, L-type calcium channel; SERCA, sarcoplasmic reticulum Ca2+-ATPase; RyR, ryanodine receptor. (Modified from Saucerman et al. 2003, with permission.) (b)–(d ). Simulated effects of G589D mutation and β-adrenergic signaling on action potential in a transmural ventricular tissue model. (b) In presence of β-adrenergic stimulation, action potentials prolong in G589D mutants (dashed line) compared with WT (solid line) preferentially in endocardial cells, forming a broad T-wave and prolonged QT interval on the simulated ECG. (c) Transmural heterogeneity of APD90 in absence (empty markers) and presence of β-adrenergic stimulation (filled markers) for WT (circles) and G589D mutant (squares) tissue models. (d ) Transmural dispersion of repolarization (TDR) is particularly elevated in sympathetic-stimulated G589D mutant models (filled squares) at long cycle lengths. (Modified from Saucerman et al. 2004, with permission.)

Similar articles

Cited by

References

    1. Abbott GW, Sesti F, Splawski I, Buck ME, Lehmann MH, Timothy KW, Keating MT, Goldstein SA. MiRP1 forms IKr potassium channels with HERG and is associated with cardiac arrhythmia. Cell. 1999;97:175–187. - PubMed
    1. Abriel H, Cabo C, Wehrens XH, Rivolta I, Motoike HK, Memmi M, Napolitano C, Priori SG, Kass RS. Novel arrhythmogenic mechanism revealed by a long-QT syndrome mutation in the cardiac Na(+) channel. Circulation Research. 2001;88:740–745. - PubMed
    1. Antzelevitch C. The Brugada syndrome: ionic basis and arrhythmia mechanisms. Journal of Cardiovascular Electrophysiology. 2001;12:268–272. - PubMed
    1. Antzelevitch C, Dumaine R. Electrical heterogeneity in the heart: physiological, pharmacological and clinical implications. In: Page E, Fozzard H, Solaro J, editors. Handbook of Physiology, Section 2 The Cardiovascular System. The Heart. I. New York: Oxford University Press; 2002. pp. 654–692.
    1. Antzelevitch C, Fish J. Electrical heterogeneity within the ventricular wall. Basic Research in Cardiology. 2001;96:517–527. - PubMed

Publication types

MeSH terms

Substances