Vortex wakes generated by robins Erithacus rubecula during free flight in a wind tunnel
- PMID: 16849236
- PMCID: PMC1578743
- DOI: 10.1098/rsif.2005.0091
Vortex wakes generated by robins Erithacus rubecula during free flight in a wind tunnel
Abstract
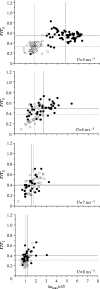
The wakes of two individual robins were measured in digital particle image velocimetry (DPIV) experiments conducted in the Lund wind tunnel. Wake measurements were compared with each other, and with previous studies in the same facility. There was no significant individual variation in any of the measured quantities. Qualitatively, the wake structure and its gradual variation with flight speed were exactly as previously measured for the thrush nightingale. A procedure that accounts for the disparate sources of circulation spread over the complex wake structure nevertheless can account for the vertical momentum flux required to support the weight, and an example calculation is given for estimating drag from the components of horizontal momentum flux (whose net value is zero). The measured circulations of the largest structures in the wake can be predicted quite well by simple models, and expressions are given to predict these and other measurable quantities in future bird flight experiments.
Figures


Similar articles
-
A family of vortex wakes generated by a thrush nightingale in free flight in a wind tunnel over its entire natural range of flight speeds.J Exp Biol. 2003 Jul;206(Pt 14):2313-44. doi: 10.1242/jeb.00423. J Exp Biol. 2003. PMID: 12796450
-
Wake structure and wingbeat kinematics of a house-martin Delichon urbica.J R Soc Interface. 2007 Aug 22;4(15):659-68. doi: 10.1098/rsif.2007.0215. J R Soc Interface. 2007. PMID: 17264054 Free PMC article.
-
Mechanical power curve measured in the wake of pied flycatchers indicates modulation of parasite power across flight speeds.J R Soc Interface. 2018 Jan;15(138):20170814. doi: 10.1098/rsif.2017.0814. J R Soc Interface. 2018. PMID: 29386402 Free PMC article.
-
Dynamics of the vortex wakes of flying and swimming vertebrates.Symp Soc Exp Biol. 1995;49:131-55. Symp Soc Exp Biol. 1995. PMID: 8571221 Review.
-
Bat flight: aerodynamics, kinematics and flight morphology.J Exp Biol. 2015 Mar;218(Pt 5):653-63. doi: 10.1242/jeb.031203. J Exp Biol. 2015. PMID: 25740899 Review.
Cited by
-
Vortex wake, downwash distribution, aerodynamic performance and wingbeat kinematics in slow-flying pied flycatchers.J R Soc Interface. 2012 Feb 7;9(67):292-303. doi: 10.1098/rsif.2011.0238. Epub 2011 Jun 15. J R Soc Interface. 2012. PMID: 21676971 Free PMC article.
-
Flow Features of the Near Wake of the Australian Boobook Owl (Ninox boobook) During Flapping Flight Suggest an Aerodynamic Mechanism of Sound Suppression for Stealthy Flight.Integr Org Biol. 2019 Feb 19;1(1):obz001. doi: 10.1093/iob/obz001. eCollection 2019. Integr Org Biol. 2019. PMID: 33793685 Free PMC article.
-
Comparing aerodynamic efficiency in birds and bats suggests better flight performance in birds.PLoS One. 2012;7(5):e37335. doi: 10.1371/journal.pone.0037335. Epub 2012 May 18. PLoS One. 2012. PMID: 22624018 Free PMC article.
-
Estimation of unsteady aerodynamics in the wake of a freely flying European starling (Sturnus vulgaris).PLoS One. 2013 Nov 22;8(11):e80086. doi: 10.1371/journal.pone.0080086. eCollection 2013. PLoS One. 2013. PMID: 24278243 Free PMC article.
-
Volumetric imaging of shark tail hydrodynamics reveals a three-dimensional dual-ring vortex wake structure.Proc Biol Sci. 2011 Dec 22;278(1725):3670-8. doi: 10.1098/rspb.2011.0489. Epub 2011 May 4. Proc Biol Sci. 2011. PMID: 21543357 Free PMC article.
References
-
- Anderson J.D. McGraw-Hill; New York: 1984. Fundamentals of aerodynamics.
-
- Bäckman J, Alerstam T. Orientation scatter of free-flying nocturnal passerine migrants: components and causes. Anim. Behav. 2003;65:987–996. doi: 10.1006/anbe.2003.2119. - DOI
-
- Biewener A.A. Oxford University Press; Oxford: 2003. Animal locomotion.
-
- Biewener A.A, Dial K.P, Goslow G.E. Pectoralis muscle force and power output during flight in the starling. J. Exp. Biol. 1992;164:1–18.
-
- Bruderer B. Radarbeobachtungen über den Frühlingszug im schweizerischen Mittellan. Orn. Beob. 1971;68:89–158.
Publication types
MeSH terms
LinkOut - more resources
Full Text Sources

