

Muscle fibre recruitment can respond to the mechanics of the muscle contraction
- PMID: 16849250
- PMCID: PMC1664648
- DOI: 10.1098/rsif.2006.0113
Muscle fibre recruitment can respond to the mechanics of the muscle contraction
Abstract
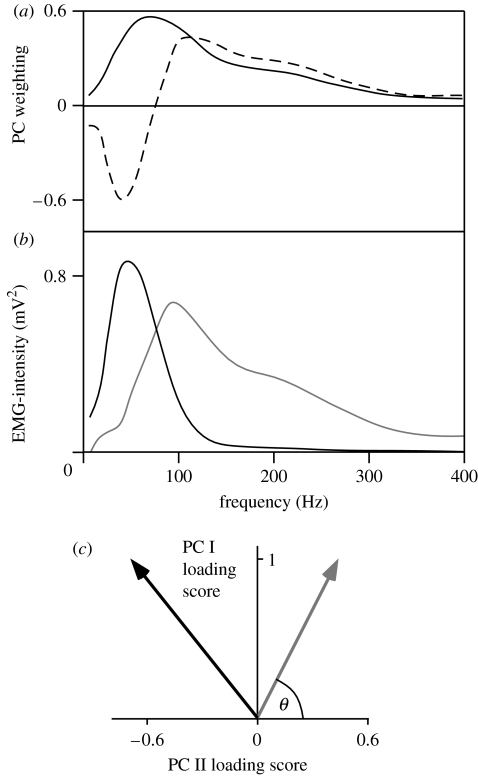
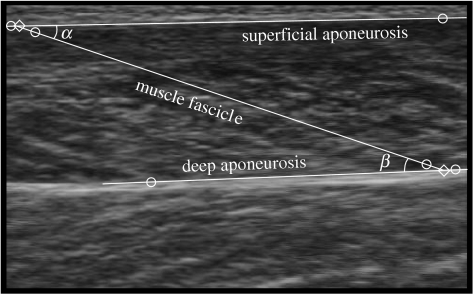
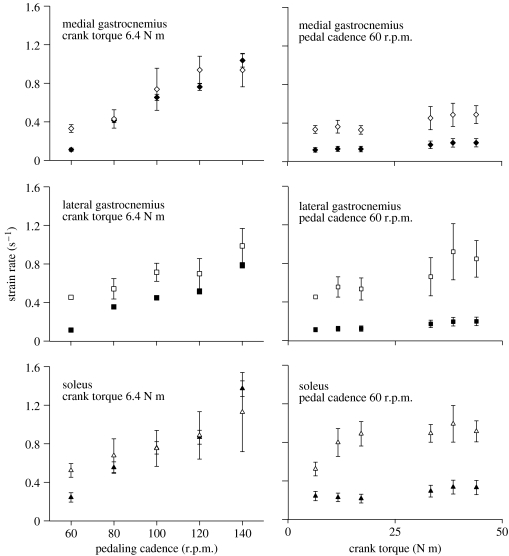
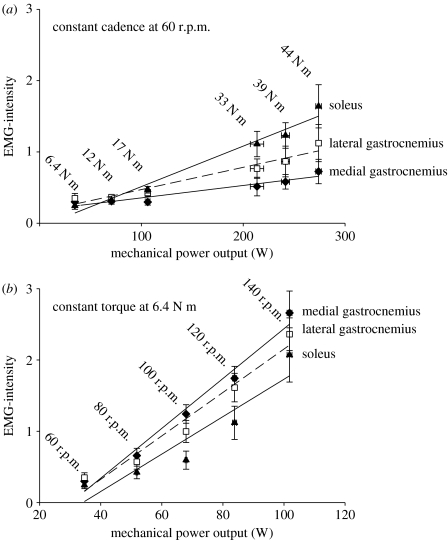
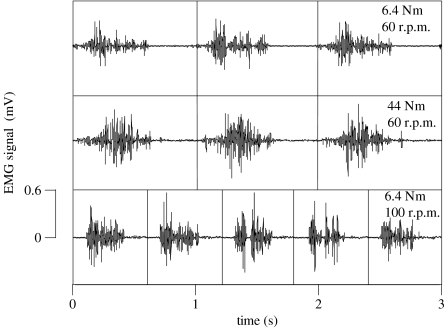
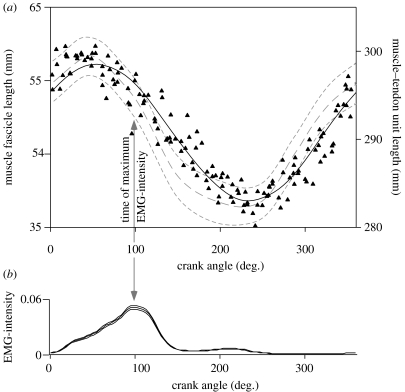
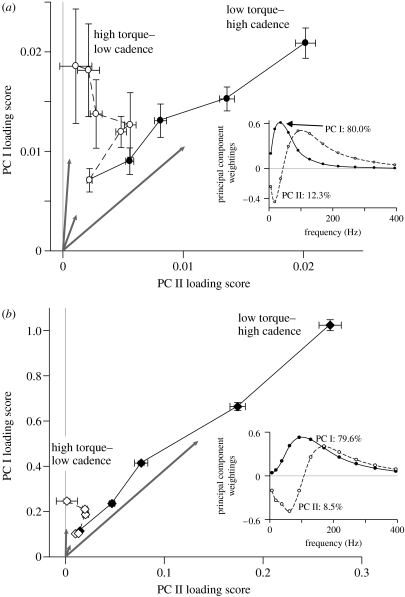
This study investigates the motor unit recruitment patterns between and within muscles of the triceps surae during cycling on a stationary ergometer at a range of pedal speeds and resistances. Muscle activity was measured from the soleus (SOL), medial gastrocnemius (MG) and lateral gastrocnemius (LG) using surface electromyography (EMG) and quantified using wavelet and principal component analysis. Muscle fascicle strain rates were quantified using ultrasonography, and the muscle-tendon unit lengths were calculated from the segmental kinematics. The EMG intensities showed that the body uses the SOL relatively more for the higher-force, lower-velocity contractions than the MG and LG. The EMG spectra showed a shift to higher frequencies at faster muscle fascicle strain rates for MG: these shifts were independent of the level of muscle activity, the locomotor load and the muscle fascicle strain. These results indicated that a selective recruitment of the faster motor units occurred within the MG muscle in response to the increasing muscle fascicle strain rates. This preferential recruitment of the faster fibres for the faster tasks indicates that in some circumstances motor unit recruitment during locomotion can match the contractile properties of the muscle fibres to the mechanical demands of the contraction.
Figures
Similar articles
-
Recruitment of faster motor units is associated with greater rates of fascicle strain and rapid changes in muscle force during locomotion.J Exp Biol. 2013 Jan 15;216(Pt 2):198-207. doi: 10.1242/jeb.072637. Epub 2012 Sep 12. J Exp Biol. 2013. PMID: 22972893 Free PMC article.
-
Early deactivation of slower muscle fibres at high movement frequencies.J Exp Biol. 2014 Oct 1;217(Pt 19):3528-34. doi: 10.1242/jeb.108266. Epub 2014 Aug 7. J Exp Biol. 2014. PMID: 25104756
-
Motor units are recruited in a task-dependent fashion during locomotion.J Exp Biol. 2004 Oct;207(Pt 22):3883-90. doi: 10.1242/jeb.01223. J Exp Biol. 2004. PMID: 15472019
-
Validation of Hill-type muscle models in relation to neuromuscular recruitment and force-velocity properties: predicting patterns of in vivo muscle force.Integr Comp Biol. 2014 Dec;54(6):1072-83. doi: 10.1093/icb/icu070. Epub 2014 Jun 12. Integr Comp Biol. 2014. PMID: 24928073 Free PMC article. Review.
-
The neural control of movement: a century of in vivo motor unit recordings is the legacy of Adrian and Bronk.J Physiol. 2024 Jan;602(2):281-295. doi: 10.1113/JP285319. Epub 2023 Dec 7. J Physiol. 2024. PMID: 38059891 Free PMC article. Review.
Cited by
-
Functional diversification within and between muscle synergists during locomotion.Biol Lett. 2008 Feb 23;4(1):41-4. doi: 10.1098/rsbl.2007.0472. Biol Lett. 2008. PMID: 17986428 Free PMC article.
-
Metabolic cost underlies task-dependent variations in motor unit recruitment.J R Soc Interface. 2018 Nov 21;15(148):20180541. doi: 10.1098/rsif.2018.0541. J R Soc Interface. 2018. PMID: 30464057 Free PMC article.
-
Comparison of human gastrocnemius forces predicted by Hill-type muscle models and estimated from ultrasound images.J Exp Biol. 2017 May 1;220(Pt 9):1643-1653. doi: 10.1242/jeb.154807. Epub 2017 Feb 15. J Exp Biol. 2017. PMID: 28202584 Free PMC article.
-
Muscle Activation and Kinematic Analysis during the Inclined Leg Press Exercise in Young Females.Int J Environ Res Public Health. 2020 Nov 23;17(22):8698. doi: 10.3390/ijerph17228698. Int J Environ Res Public Health. 2020. PMID: 33238589 Free PMC article.
-
Accuracy of gastrocnemius muscles forces in walking and running goats predicted by one-element and two-element Hill-type models.J Biomech. 2013 Sep 3;46(13):2288-95. doi: 10.1016/j.jbiomech.2013.06.001. Epub 2013 Jul 18. J Biomech. 2013. PMID: 23871235 Free PMC article.
References
-
- Basmajian J.V. Control and training of individual motor units. Science. 1963;141:440–441. - PubMed
-
- Block J.H, Stegeman D.F, van Oosterom A. Three-layer volume conductor model and software package for applications in surface electromyography. Ann. Biomed. Eng. 2002;30:566–577. doi:10.1114/1.1475345 - DOI - PubMed
-
- Bottinelli R, Reggiani C. Human skeletal muscle fibres: molecular and functional diversity. Prog. Biophys. Mol. Biol. 2000;73:195–262. doi:10.1016/S0079-6107(00)00006-7 - DOI - PubMed
-
- Brand R.A, Crowninshield R.D, Wittstock C.E, Pederson D.R, Clark C.R, van Krieken F.M. A model of the lower extremity muscular anatomy. J. Biomech. Eng. 1982;104:304–310. - PubMed
-
- Broman H, De Luca C.J, Mambrito B. Motor unit recruitment and firing rates interaction in the control of human muscles. Brain Res. 1985;337:311–319. doi:10.1016/0006-8993(85)90068-X - DOI - PubMed
Publication types
MeSH terms
LinkOut - more resources
Full Text Sources
Other Literature Sources
Medical
