. 2006 Aug 22;3(9):561-71.
doi: 10.1098/rsif.2006.0117.

An experimental study into the acousto-mechanical effects of invading the cochlea

Affiliations

An experimental study into the acousto-mechanical effects of invading the cochlea

Wei Dong et al. J R Soc Interface. .

Abstract

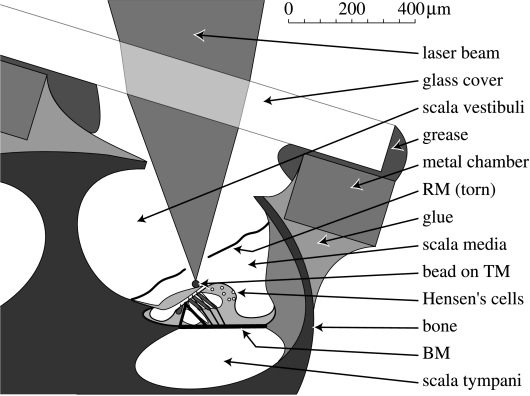
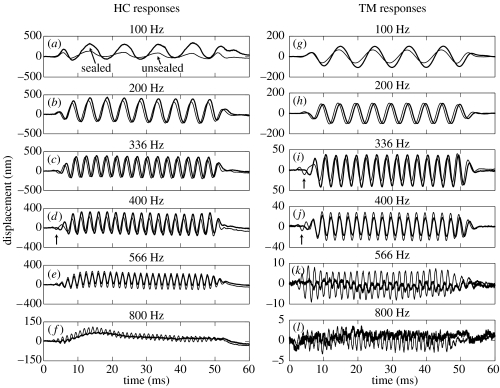
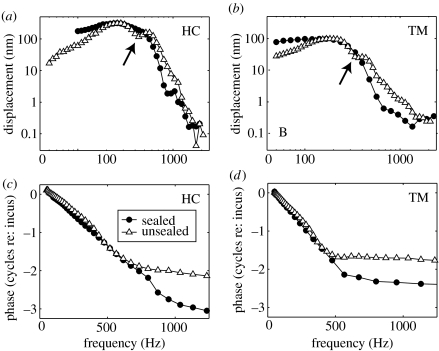
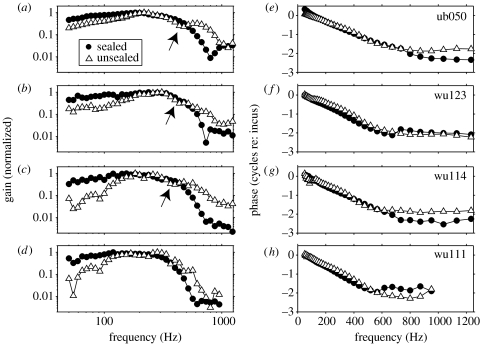
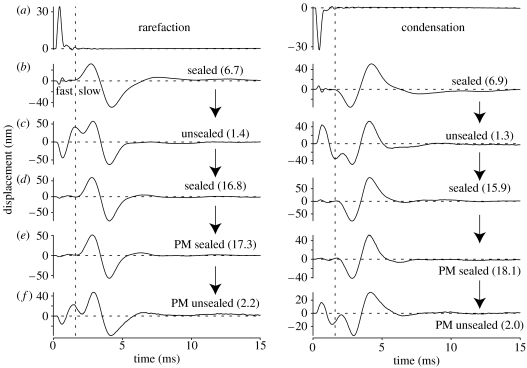
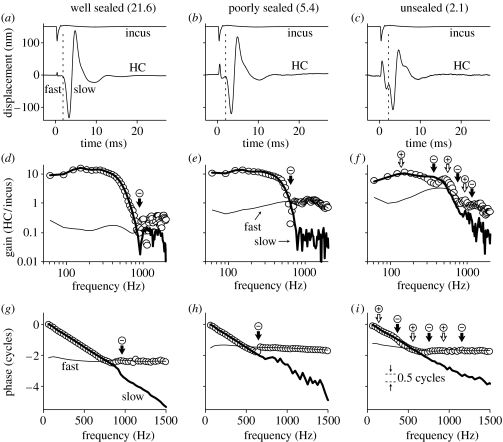
The active and nonlinear mechanical processing of sound that takes place in the mammalian cochlea is fundamental to our sense of hearing. We have investigated the effects of opening the cochlea in order to make experimental observations of this processing. Using an optically transparent window that permits laser interferometric access to the apical turn of the guinea-pig cochlea, we show that the acousto-mechanical transfer functions of the sealed (i.e. near intact) cochlea are considerably simpler than those of the unsealed cochlea. Comparison of our results with those of others suggests that most previous investigations of apical cochlear mechanics have been made under unsealed conditions, and are therefore likely to have misrepresented the filtering of low-frequency sounds in the cochlea. The mechanical filtering that is apparent in the apical turns of sealed cochleae also differs from the filtering seen in individual auditory nerve fibres with similar characteristic frequencies. As previous studies have shown the neural and mechanical tuning of the basal cochlea to be almost identical, we conclude that the strategies used to process low frequency sounds in the apical turns of the cochlea might differ fundamentally from those used to process high frequency sounds in the basal turns.


Figures

Figure 1
Figure 1
The interferometric approach to the apical turn of the guinea-pig cochlea, showing schematic details of the artificial chamber that permits the apical cochlea to be sealed and unsealed. The laser interferometer is shown focused on a reflective bead that has been deposited on the tectorial membrane (TM) via a small tear in Reissner's membrane (RM). Recordings from the naturally reflective lipid droplets (white circles) in the Hensen's cell region were made both before and after the RM was torn (see §2 for details). BM, basilar membrane.
Figure 2
Figure 2
HC and TM responses to tone bursts in one cochlea (wub92). Bold and thin lines depict responses under sealed and unsealed conditions, respectively. (a–f) HC responses recorded before the RM was torn to expose the TM. (g–l) TM responses recorded after tearing the RM. Arrows in (d), (i) and (j) point out ‘early onset’ and ‘phase-reversed’ response components observed under unsealed conditions (as described in text). Stimulus level=80 dB SPL. Responses averaged 16×.
Figure 3
Figure 3
Tuning characteristics derived from HC and TM responses to tone bursts in one cochlea (wub92). (a, b) Response amplitudes evoked by 80 dB SPL stimuli under sealed and unsealed conditions (filled circles and open triangles, respectively). Arrows point to mid-band sensitivity notches observed under unsealed conditions. (c, d) Corresponding phase data, expressed relative to the incus responses in the same ear.
Figure 4
Figure 4
Transfer functions derived from HC responses to 80 dB SPL tone bursts in four cochleae. Filled circles and open triangles show responses observed under sealed and unsealed conditions, respectively. All of the responses have been normalized by the incus responses observed in the same ears, and response amplitudes are expressed with respect to their peak values (i.e. normalized to a peak ‘gain’ of 1; see text).
Figure 5
Figure 5
Responses to rarefaction and condensation clicks in one cochlea (ub050). (a) Responses recorded from the incus. (b–f) Responses from a small cluster of HCs under different hydraulic and physiological conditions. The apical cochlea was initially (b) sealed, (c) became unsealed and (d) was re-sealed using a new cover-slip. Post-mortem (PM) measurements were then made under (e) sealed conditions before the cover-slip was dislodged manually to obtain the final (f) unsealed waveforms. The vertical dashed lines mark the onset of the major HC response component under sealed cochlear conditions. These lines serve as a boundary to separate the ‘fast’ and ‘slow’ components of each response, despite the fact that the components overlap when the cochlea is unsealed (see text). The numbers in parentheses alongside each waveform indicate the ratio of the peak-to-peak amplitudes of the response components occurring on either side of the vertical line (i.e. the slow component's peak-to-peak amplitude divided by the fast component's peak-to-peak amplitude). Peak-equivalent stimulus levels=80 dB SPL. Responses averaged 250×. The RM was intact during all measurements.
Figure 6
Figure 6
Frequency-dependent interactions between ‘fast’ and ‘slow’ response components in one cochlea (wu126). (a–c) HC and incus responses to rarefaction clicks under three different sealing conditions, as labelled. Vertical dashed lines are used to separate each HC response into fast and slow components. The numbers in parentheses above each panel indicate the ratio of the peak-to-peak amplitudes of the fast and slow HC response components (i.e. the slow component's peak-to-peak amplitude divided by the fast component's peak-to-peak amplitude). (d–f) Amplitude transfer functions derived from data in (a–c), respectively. The fast and slow components (thin and bold solid lines, respectively) were analysed after separating the responses in the time-domain using a 720 μs wide raised-cosine ramp function centred on the dashed lines in (a–c). The transfer functions for the complete time-domain responses are shown as open circles. (g–i) Corresponding phase transfer functions. The fast component phases have been offset by either 1.0 or 2.0 cycles to facilitate their comparison with the complete phase transfer functions (open circles). The arrows in (d–i) indicate a selection of frequencies where the fast and slow components occur exactly in-phase (+, open arrows) or in anti-phase (−, solid arrows). Peak-equivalent stimulus levels=80 dB SPL. Responses averaged 250×. The RM was intact during all measurements.

References

    1. Allen J.B. Cochlear micromechanics—a physical model of transduction. J. Acoust. Soc. Am. 1980;68:1660–1670. doi:10.1121/1.385198 - DOI - PubMed
    1. Békésy G.v. McGraw-Hill; New York: 1960. Experiments in hearing.
    1. Cooper N.P. Mid-band sensitivity notches in apical cochlear mechanics. In: Hecht-Poinar E, editor. Diversity in auditory mechanics. World Scientific; Singapore: 1996. pp. 298–304.
    1. Cooper N.P. An improved heterodyne laser interferometer for use in studies of cochlear mechanics. J. Neurosci. Methods. 1999;88:93–102. doi:10.1016/S0165-0270(99)00017-5 - DOI - PubMed
    1. Cooper N.P, Dong W. Sound-evoked changes in the baseline position of the cochlear partition at the apex of the guinea-pig cochlea. J. Physiol. 2000;527P:90P.

Publication types